Browse categories
English
$
USD
Connect to your AI

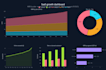
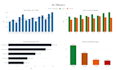


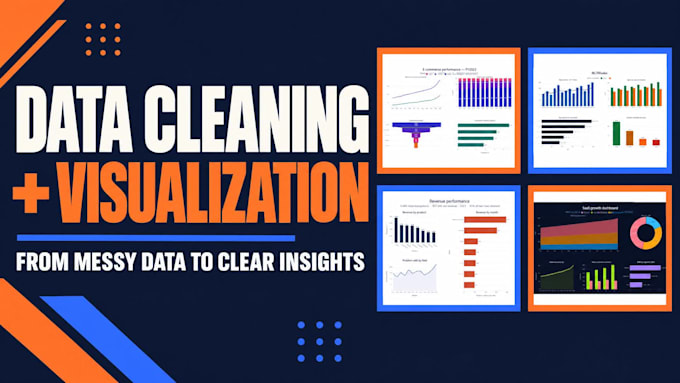
Are you tired of messy, unstructured spreadsheets? Let me transform your raw data into stunning, professional interactive charts!
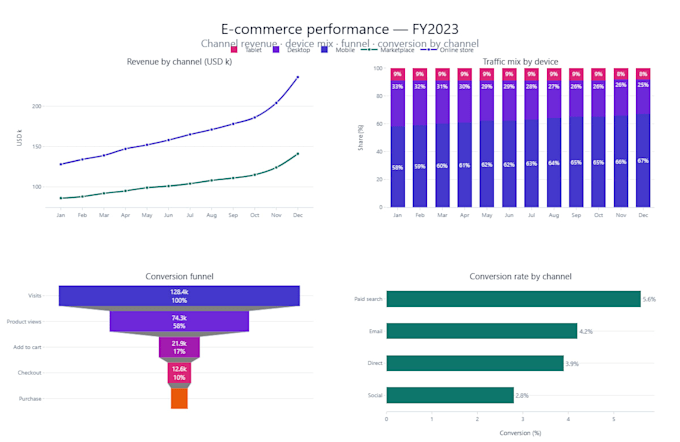
I specialize in Python data cleaning and Plotly visualization. I will take your dirty data, remove duplicates, handle missing values, fix date formats, and turn it into a clear, interactive dashboard.
**What you will get:**
- Professional Data Cleaning (up to 500 rows for Basic)
- A clear Data Quality Report (showing what was fixed)
- Fully interactive HTML charts (zoom, hover, filter)
- High-quality static PNG images for your PPT/Report
**Tech Stack:** Python, Pandas, Plotly.
**Why choose me?**
I don't just deliver code; I deliver clean, actionable insights. If your data is a mess, send it to me first, and I will tell you exactly how I can fix it.
**Requirements:**
- Your raw data (CSV / Excel)
- The metrics you want to highlight
Message me before ordering if your dataset is large (over 500 rows) or if you have custom requirements!
Python Automation and Small Script Development
Languages
What file will I receive?
You will receive 3 files: 1. Cleaned Data file (Excel/CSV). 2. Interactive HTML charts. 3. High-quality static PNG images for your reports.
Can I change chart colors?
Yes, standard color adjustments are included in your package revisions. For a complete custom theme (specific hex codes/company branding), please message me for a custom offer.
Do you handle huge datasets?
My Basic package covers up to 500 rows. If your dataset is larger, please message me BEFORE ordering. I will review your data and send you a custom offer.