Browse categories
English
$
USD
Connect to your AI

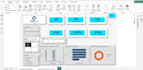


Need a clear view of your business performance? I will turn your Excel or CSV data into an interactive Power BI dashboard with meaningful KPIs, charts, slicers and business insights.
I clean and model your data with Power Query, write DAX measures for the numbers that matter, and design a dashboard with slicers and cross-filtering, so you can explore by date, product, region, or category. I also work with finance and operations reports.
Recent work includes a two-page healthcare operations dashboard with KPIs, slicers, and cross-filtering, plus an Excel sales dashboard with a 2025 revenue forecast. Both are in my portfolio.
You'll receive a tidy, interactive Power BI file (.pbix) with a clean layout, meaningful KPIs, and data that refreshes when your Excel file is updated.
To get started, send your Excel or CSV file (dummy data is fine) and the KPIs you want to track. Live connections and advanced forecasting may need a custom offer, so message me if your project is bigger. I'm an Economics and Mathematics graduate from IBA Karachi.
Data Analyst, Excel Automation, Power BI, and KNIME
Languages
How fast can you deliver the work?
I offer fast delivery, with basic packages delivered within 1 day. For faster service, I also provide an option for expedited delivery.
What do I need to send?
Your Excel or CSV file (dummy data is fine), the KPIs you want to track, and any color or branding preferences.
Will the dashboard refresh with new data?
Yes, if your data comes from Excel or CSV files with the same structure. Message me for other connections.
Do I need Power BI Pro to view it?
I deliver a .pbix file you can open in free Power BI Desktop. Sharing online needs a Power BI account.


