Browse categories
Explore
Fiverr Pro
English
$
USD
Python Developer Data Cleaning Automation Web Scraping
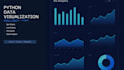
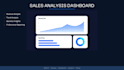
Do you need professional charts and visual reports from your data?
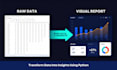
I will create clear and insightful data visualizations using Python and Matplotlib from CSV, Excel, or Google Sheets data.
Services include:
Bar Charts
Line Charts
Pie Charts
Histograms
Trend Analysis Charts
Custom Visual Reports
Tools:
Why choose me?
Accurate Results
Clean Visualizations
Fast Delivery
Professional Communication
Please contact me before placing an order for large datasets or custom requirements.
Expertise:
Business Insights
•
Trends
•
Math
•
Statistics
Technology:
Excel
•
Google Sheets
•
Jupyter Notebook
•
Other
Programming language:
Python
What file formats do you accept?
I accept CSV, Excel (.xlsx, .xls), and Google Sheets data for visualization projects.
What types of charts can you create?
I can create bar charts, line charts, pie charts, histograms, and custom data visualizations using Python.
Can you visualize large datasets?
Yes. Please contact me before ordering if your dataset is very large or requires multiple visual reports.
Will I receive the chart files?
Yes. You will receive the charts as PNG images, PDF reports, or other requested formats.
Can you create custom charts based on my requirements?
Yes. I can customize chart types, labels, titles, and layouts according to your needs.
Do you provide insights along with the charts?
Yes. Standard and Premium packages include insights and analysis based on the visualized data.
What tools do you use for visualization?
I use Python, Pandas, NumPy, and Matplotlib to create professional data visualizations.
Is my data kept confidential?
Yes. All files and information shared with me remain private and are used only for project completion.


