Browse categories
Explore
Fiverr Pro
English
$
USD
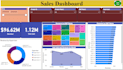
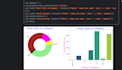
Data Cleaning, Analysis and Interactive Dashboards
As an Experienced Data Analyst proficient in Python, Advanced Excel, and Power BI, I focus on delivering results not just reports.
WHAT I OFFER:
️WHY CHOOSE ME? (NEW SELLER DISCOUNT)
I offer high-quality service at a special introductory price to build my portfolio and earn your 5-star review. Your satisfaction is my top priority!
IMPORTANT: Please message me with your data size (number of rows) and project goals before ordering for the best package selection.
What if my dataset has more rows than the limit specified in your package?
No problem! My packages are priced based on complexity and volume. If your data exceeds the limit (e.g., more than 5,000 rows), please contact me first with the file size and your requirements. I will create a Custom Offer tailored to your exact needs.
What kind of final output will I receive?
Depending on the package, you will receive: Basic: Cleaned data file (Excel/CSV) and image files of the charts (PNG/JPG). Standard/Premium: The Power BI file (PBIX), a PDF summary report of the insights, and the final data file.
Is my data safe and kept confidential?
Absolutely. Data privacy is my top priority. All your files and project details will be kept strictly confidential and will be deleted from my system immediately after the order is completed and rated
What do you need from me to start the analysis?
To start, I primarily need two things: Your Data File: (CSV, Excel, or Database access details). Your Goal: A clear explanation of the specific business questions you need the data to answer.
What is the difference between a revision and changing the scope of work?
A Revision is a small adjustment to the existing analysis (e.g., changing a chart colour, re-formatting a label). Changing the Scope means asking for a brand new analysis, adding significant new data, or requesting a different model, which may require a new Custom Offer.
Can you work with Google Sheets, database connections (SQL), or just Excel files?
I am flexible! I can work with static files (CSV, Excel), but for an extra charge (see Gig Extras), I can also connect directly to SQL databases or Google Sheets and update data sources for your Power BI dashboard.
Do you offer support after the final delivery is accepted?
My service includes support during the project review phase. For post-delivery support (e.g., updating the dashboard with new data weeks later), please check my Gig Extras for a Maintenance/Support package, or contact me for a quick custom quote.


