Browse categories
English
$
USD
Connect to your AI

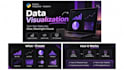

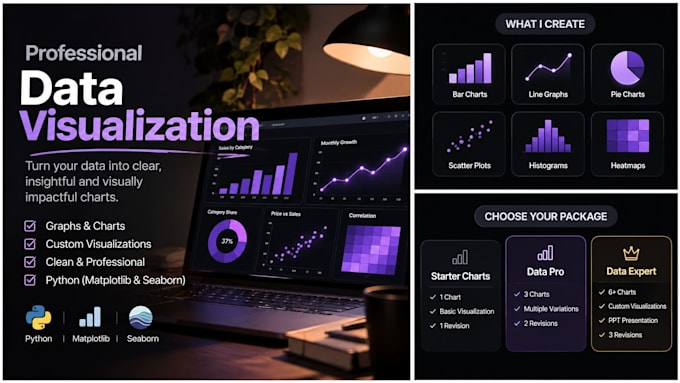
Turn raw data into clear, meaningful visuals!
Need professional graphs and charts to understand your data better? I will transform your datasets into clean, visually appealing visualizations using Python Matplotlib and Seaborn.
WHAT I OFFER:
WHAT YOU GET:
Whether you're working on a college project, business report or data analysis task, I'll help make your data easier to understand.
Message me before ordering for custom requirements!
BCA Student Data Analyst Intern
Languages
Q1. What types of charts can you create?
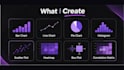
I can create bar charts, line graphs, pie charts, histograms, scatter plots, heatmaps and other custom visualizations.
Q2. Which tools do you use?
I use Python Matplotlib and Seaborn to create data visualizations.
Q3. What file formats do you accept?
I accept CSV and Excel files (.csv, .xlsx and .xls).
Q4. Will I receive the Python source code?
Yes, Python scripts or Jupyter Notebooks are included depending on the package you select.