Browse categories
Explore
Fiverr Pro
English
$
USD
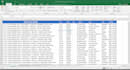
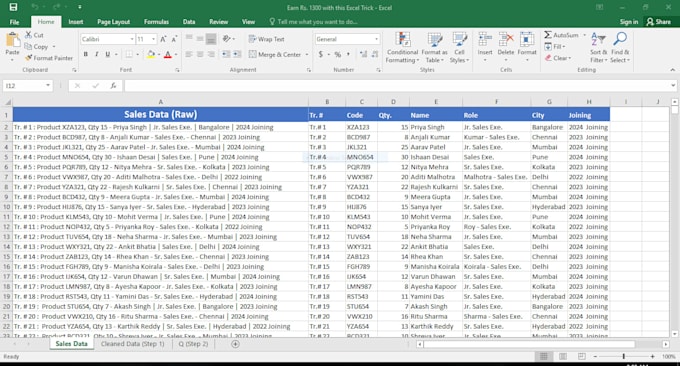
Starting with Excel data cleaning, analysis, and visualization work involves a few key steps:
Data Cleaning
1. Import Data: Open Excel and load your data file.
2. Remove Unnecessary Data: Delete columns or rows that aren't needed.
3. Correct Errors: Fix any typos or incorrect entries.
4. Handle Missing Data: Fill in missing values or remove incomplete rows.
5. Standardize Data: Ensure consistency in data formats (e.g., dates, currency).
Data Analysis
1. Sort and Filter: Organize data to find patterns or specific entries.
2. Pivot Tables: Summarize large data sets to see trends and patterns.
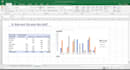
Data Visualization
1 Charts and Graphs: Create visual representations like bar charts, line graphs, and pie charts.
2. Dashboards: Combine multiple charts and data points into a single view for easy analysis.
By following these steps, you can clean your data, analyze it for insights, and visualize the results for easy interpretation.