I will do professional data visualizations

X
xolafreelancer
X
xolafreelancer
XOLA

About this gig

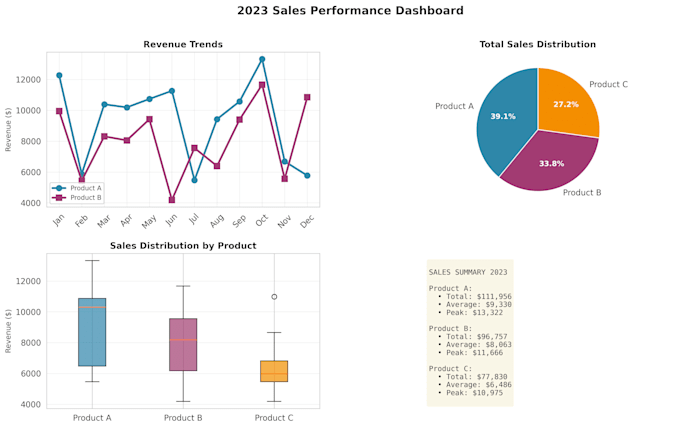
Your data has a story. I'll make sure people can see it clearly.

I create professional, publication-ready data visualizations using Python and Power BI.

What I deliver:

  • Bar charts, line graphs, scatter plots, heatmaps, histograms
  • Correlation and distribution analysis visuals
  • Interactive dashboards with filters and drill-down
  • Clear labelling, consistent color schemes, export-ready

BSc Computer Science & Statistics student with distinction-level expertise. I care about details, axis labels, clean legends, and making charts tell the right story.

Send me your dataset and requirements, let's visualize your insights.

Get to know XOLA

XOLA

Data Scientist ,Python, SQL, EDA and Dashboards

  • FromSouth Africa
  • Member sinceApr 2026
  • Avg. response time1 hour
  • Languages

    English
Final-year BSc Computer Science & Statistics student at Nelson Mandela University, currently completing a Data Science & Engineering programme at Explore AI Academy (ALX). I help clients make sense of their data using Python, SQL, Pandas, and data visualisation tools — from cleaning messy datasets to delivering clear EDA reports and dashboards. Trilingual (isiXhosa, English, isiZulu), detail-oriented, and identity-verified on Upwork. Let's turn your data into something useful.

Related tags