Browse categories
Explore
Fiverr Pro
English
$
USD


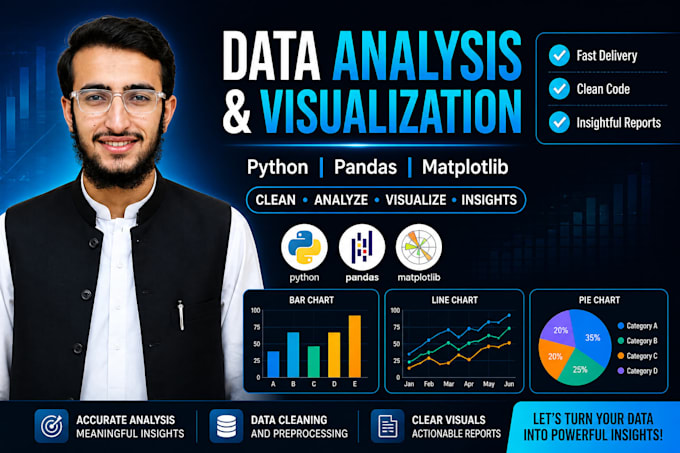
Turn your raw data into clear, actionable insights with professional Python visualizations.
I specialize in data cleaning, statistical analysis, and custom charts using Pandas, Matplotlib, and Seaborn perfect for reports, presentations, and dashboards.
What I Deliver:
Clean, analysis-ready datasets (missing values fixed, formatting corrected)
Statistical summaries and trend identification
Custom charts: bar, line, scatter, pie, heatmap, histogram, box plot, and more
Correlation and trend visualizations
Delivery in PDF, PNG, PowerPoint, or raw code (.ipynb)
Step-by-step explanation of every analysis
Why Choose Me?
⭐ Transparent workflow you see every step
⭐ Fast delivery with unlimited revisions
⭐ Presentation-ready visuals for reports, theses, or business meetings
⭐ Code included so you can reproduce the analysis
Perfect For:
Students & researchers (thesis data, survey analysis)
Startups & businesses (sales trends, customer insights)
Anyone who needs data-driven decisions without the complexity
Need automation for recurring analysis? Add my gig extra for automated Python scripts.
Message me your data and goals let's turn your numbers into insights today!
Languages
What kind of data can you work with
I can work with almost any type CSV, Excel, JSON, or database exports. Whether it’s sales data, research results, or system logs, I’ll clean, analyze, and visualize it using Python tools like Pandas, Matplotlib, and Seaborn.
Will I receive the code?
Yes! All packages include the Python code (.ipynb Jupyter notebook) so you can reproduce the analysis. Premium package also includes a detailed PDF report.
Will you explain the results to me
Absolutely. I provide step-by-step explanations of every chart and finding. If you need a video walkthrough, add it as a gig extra.
Can you customize the charts to match my style or brand?
Yes. I can adjust colors, fonts, labels, and chart styles to match your brand guidelines or presentation theme. Just share your requirements.
How fast can you deliver?
Basic: 1 day. Standard: 2 days. Premium: 3 days. Need it faster? Contact me before ordering rush delivery may be available.
Can you handle large datasets and automate repeated analysis?
Yes. For datasets over 50,000 rows or recurring monthly/weekly analysis, I offer automation as a gig extra. Message me for a custom solution.