Browse categories
Explore
Fiverr Pro
English
$
USD
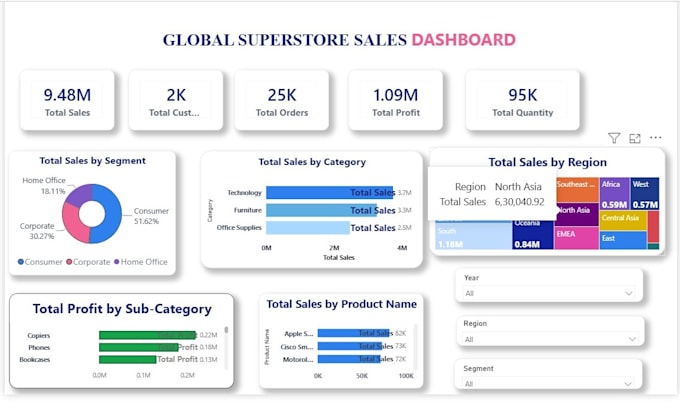
I will analyze your Excel or CSV data and turn it into a clear KPI dashboard you can share with your team.
Stop guessing from messy spreadsheets. I clean your data, define the right metrics, and deliver charts a manager can actually use.
This gig is for you if you need: Sales, finance, operations, or marketing reports Weekly or monthly KPI tracking A simple dashboard instead of raw tables Short insights, not just pretty charts.
How I work:
Packages: Basic (Starter Charts): 1 file, up to 1,000 rows, problem definition, 3 charts Standard (KPI Dashboard): 12 files, up to 10,000 rows, dashboard with up to 8 KPIs, insights summary Premium (Executive Report): multiple files, up to 50,000 rows, dashboard with up to 15 KPIs, insights, 1-page executive summary.
Please send: Your Excel or CSV file Your goal (sales drop, monthly KPIs, cost review, etc.) Any KPIs you already track.

Which package should I choose?
Choose Basic for 3 simple charts. Choose Standard if you need an Excel KPI dashboard and a short insights summary. Choose Premium for a full dashboard plus a 1-page executive summary for leadership.
What do I need to send you?
Send your Excel or CSV file, your goal (for example sales, costs, or monthly KPIs), and any metrics you already track. One file is enough for Basic. Standard and Premium can take more files.