Browse categories
Explore
Fiverr Pro
English
$
USD


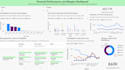
Are you looking for a complete data visualization and data analytics project that turns raw data into clear, meaningful insights? I will help you analyze, clean, and visualize your data using Python, R programming, Power BI, and Tableau.
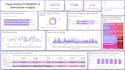
I create professional charts, dashboards, and custom visualizations for businesses, researchers, and startups. Whether you need python data visualization, R analysis, a Power BI dashboard, or Tableau visuals, I can deliver accurate, well-structured, and visually appealing results.
My services include data cleaning, exploratory data analysis, dynamic data interaction, trend analysis, enhanced KPI tracking visualization, interactive dashboards, and custom charts based on your goals. I work with Excel, CSV, SQL, APIs, and large datasets, and I focus on both presentation quality and analytical value.
Whether your project is for business, research, reporting, or decision-making, I will deliver a complete visualization solution with professional output and organized source files.
Lets transform your data into visuals that are easy to understand and valuable to use.
Data Scientist, AI Python Developer and GIS Specialist
Languages


