Browse categories
English
$
USD
Connect to your AI

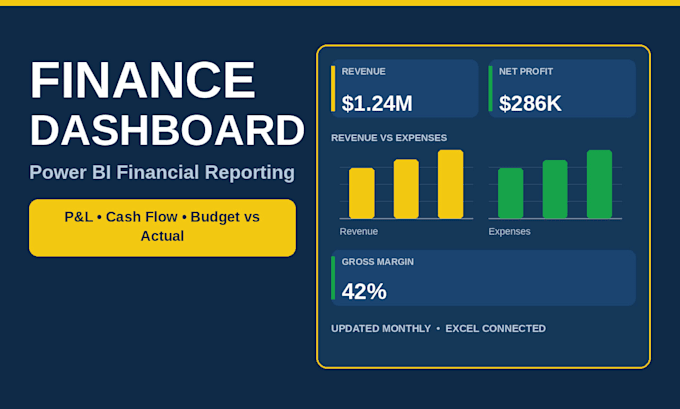
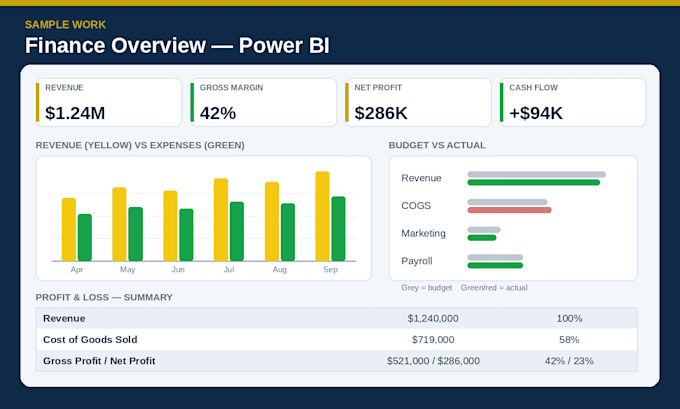
Month-end reporting should not mean three days of copying figures between spreadsheets. I build Power BI finance dashboards that turn your accounting and Excel data into a live view of profit, cash and budget performance refreshed in minutes, not rebuilt every month.
**What You Get**
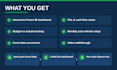
Interactive Power BI dashboard (.pbix + PDF snapshot)
Profit & loss: revenue, costs, gross and net profit
Breakdowns by month, department, product or customer
Cash flow: inflows, outflows and balance trend
Budget vs actual, with variances highlighted
AR/AP ageing views (Standard and Premium)
Ratios and KPIs: margins and expense ratios
Filters and drill-down to transactions
**How It Works**
Send sample data (Excel, CSV, or QuickBooks/Xero export) and your chart of accounts. I confirm pages, KPIs and calculations, reconcile totals to your source data, and send a preview for feedback.
**Why Work With Me**
I am a data analyst with a statistics degree, and finance reporting is built on accuracy first. I reply fast and am available by chat or video call.
Message me before ordering with your data source and the statements you report today.
Data Analyst and Data Visualization Expert
Languages
Q: Can you work from Excel files instead of accounting software?
A: Yes. Most orders start from Excel or CSV exports, and the dashboard is built so you can drop in next month’s export and refresh. Direct connections can be discussed for Premium orders.
Q: Will the numbers match my existing reports?
A: That is the acceptance test I use: headline totals are reconciled to your source data and your existing report before delivery. If I find a difference, I show you exactly where it comes from.
Q: Can you add budget vs actual?
A: Yes — send your budget in any spreadsheet format and the Standard and Premium packages include variance amounts, percentages and conditional highlighting for over- and under-budget lines.
Q: Do you also do HR or sales dashboards?
A: Finance is this gig’s focus. A simple HR/headcount view can sometimes be added as a custom extra if your data is ready — message me and I will be honest about fit. A dedicated HR dashboard gig is planned separately.
Q: What do I receive at the end?
A: The editable .pbix file, a PDF snapshot of each page, and a short written guide to refreshing the data. Premium also includes a live walkthrough call.