Browse categories
Explore
Fiverr Pro
English
$
USD


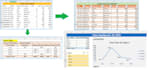


I will create professional pivot tables, interactive charts, and clear graphs from your Excel data. My accurate analysis delivers actionable insights that help you make better business decisions.
Please read the FAQs below before ordering. Most questions are answered there.
Excel Data Cleaning, Formulas, Pivot Tables
Languages
FAQ 1: What do you need from me to start?
Please send me your Excel file (or Google Sheets link). Also tell me: What is the purpose of this report? (Example: "Show total sales by product") Which columns should be summarized in the pivot table?What chart type do you prefer? (Bar, Column, Line, Pie, etc.) Any specific deadline? I will review.
FAQ 2: What chart types do you offer?
I create: • Bar Charts – Compare categories (e.g., sales by product) • Column Charts – Show trends over time (e.g., monthly revenue) • Line Charts – Display continuous trends and growth patterns • Pie Charts – Show proportional data/percentages (best for 3-6 categories)
FAQ 3: Do you clean my data before making pivot tables?
This gig focuses on pivot tables and charts. For best results, your data should already be clean (no duplicates, consistent dates, no blank rows). If your data is messy, I recommend ordering my Data Cleaning Gig first.
FAQ 4: Can you add slicers (filters) to my report?
Yes, slicers are included in the Premium package. Slicers are clickable filter buttons that let you explore data by date, region, product, or any column you choose. They make your report interactive and professional.
FAQ 5: How many rows can you handle?
• Basic package – Up to 500 rows • Standard package – Up to 1000 rows • Premium package – Up to 2000 rows If you have more than 2000 rows, please message me before ordering. I can create a custom offer for larger files.
FAQ 6: Will you explain what the pivot table and chart mean?
I will add clear titles, labels, and a brief summary of what the data shows. In the Premium package, I also include a separate summary sheet with key insights and findings. For detailed data analysis or interpretation, please message me—I can offer that as a custom service.
FAQ 7: Do you work with Google Sheets?
Yes. I can work with Google Sheets directly. Just share the link with edit access. I will create the pivot tables and charts in Google Sheets (or download to Excel and send back). All functionality will be preserved.
FAQ 8: What if I am not satisfied with the work?
Your satisfaction is my priority. I offer free revisions: • Basic – 1 revision • Standard – 2 revisions • Premium – 2 revisions