Browse categories
Explore
Fiverr Pro
English
$
USD
Website Developer AI Automation Expert
Level 2
Has met high performance criteria and has a proven track record for meeting client expectations.
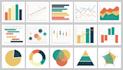
Turn your raw data into clear, interactive insights.
I specialize in creating custom charts and dashboards across Excel, Google Sheets, and websitesso whether your data lives in a spreadsheet or a live system, I can transform it into visuals that are easy to understand and act on.
What I can build:
Where I work:
Data integration:
What makes this different:
I dont just create chartsI build decision-making tools. Your data will be interactive, visually clear, and designed to highlight what actually matters.
Whether you need a simple chart or a full real-time dashboard, Ill help you present your data in a way that drives results.

What types of data visualizations do you offer?
I offer a wide range of visualizations, including Pie Charts, Bar Charts, Line Graphs, Sales Dashboards, Bubble Charts, Gantt Charts, Scatter Plots, and advanced options like Choropleths, Force Layout Graphs, and Interactive Maps.
Can you help me decide which visualization is best for my data?
Absolutely! I can guide you in selecting the most effective visualizations based on your data and goals. Just provide an overview of your data, and I’ll recommend options that will make it easy to understand and impactful.
Which data sources do you support?
I work with data from SQL, Google Sheets, JSON, XML, APIs, MySQL, CSV files, and Website APIs. If your data source isn't listed, feel free to ask—most formats are supported.
Can you integrate visualizations into my existing website or platform?
Yes! I can seamlessly integrate visualizations into platforms like WordPress, Node.js, PHP, .NET, Wix, or any custom website, ensuring smooth compatibility and responsiveness
Do you provide support for multiple JavaScript libraries?
Yes, I specialize in D3.js, Chart.js, Google Charts, Amcharts, and others, so I can tailor the project to your preferred library or choose the best one for your needs.
Is it possible to update or change the visualizations over time?
Definitely. I offer version updates for D3.js and can make adjustments to your visualizations as your data or requirements evolve.
What’s the process to start a project?
Just send me a message with details about your data and visualization needs. I’ll review it, discuss options with you, and once we’re aligned, I’ll start building your custom visualization.
Do you offer revisions?
Yes, I offer a set number of revisions to ensure you’re fully satisfied with the final result. Specific details will be discussed during the project setup
Can you provide interactive elements in visualizations?
Yes! I can add interactive elements like dropdowns, sliders, calendars, and tooltips for enhanced user engagement.
Do you create charts in WordPress using Chartjs?
Yes, I create charts in WordPress using Chartjs , Amchart and D3.js.
| (8) | ||
| (1) | ||
| (0) | ||
| (0) | ||
| (0) |

simon__kaufmann

Austria
Abid works quick, accurate and has a very deep understanding of how to create something that works exactly how one imagines. Also the communication was very clear and he was quick to respond. I am looking forward to future projects with him!
$50-$100
Price
3 days
Duration
simon__kaufmann
Austria
Abid is working fast, precise and very professional. I will continue working with him. I like, that you will not get a „This is not possible“ from him. Great work. I do recommend.
$100-$200
Price
2 days
Duration
pinpointalerts

Ireland
Abid is a ChartJS guru. We will definitely be calling on him again. Excellent communications throughout, the quality of work was exceptional, and value for money was great too. AAA+++
Up to $50
Price
2 days
Duration
aron143

United Kingdom
Great Job. Thank you
Up to $50
Price
2 days
Duration
ethanpickner

United States
Very responsive and helped me get to the end result. Would work with him again on projects.
$200-$400
Price
9 days
Duration

Seller's Response
| (8) | ||
| (1) | ||
| (0) | ||
| (0) | ||
| (0) |
simon__kaufmann
Austria
Abid works quick, accurate and has a very deep understanding of how to create something that works exactly how one imagines. Also the communication was very clear and he was quick to respond. I am looking forward to future projects with him!
$50-$100
Price
3 days
Duration
simon__kaufmann
Austria
Abid is working fast, precise and very professional. I will continue working with him. I like, that you will not get a „This is not possible“ from him. Great work. I do recommend.
$100-$200
Price
2 days
Duration
pinpointalerts
Ireland
Abid is a ChartJS guru. We will definitely be calling on him again. Excellent communications throughout, the quality of work was exceptional, and value for money was great too. AAA+++
Up to $50
Price
2 days
Duration
aron143
United Kingdom
Great Job. Thank you
Up to $50
Price
2 days
Duration
ethanpickner
United States
Very responsive and helped me get to the end result. Would work with him again on projects.
$200-$400
Price
9 days
Duration
Seller's Response


