Browse categories
Explore
Fiverr Pro
English
$
USD

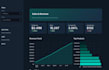
Turn your spreadsheet, CSV, or database into a slick interactive dashboard
your whole team can use no coding required to operate it.
I build Streamlit data apps that go from raw data to shareable web app.
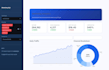
Charts, filters, KPI cards, data tables all interactive, all in your
browser, all built around your actual data.
WHAT YOU GET:
Custom Streamlit dashboard built around your data
Interactive filters (dropdowns, date ranges, sliders)
Charts: bar, line, scatter, pie whatever suits your data
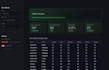
KPI / metric summary cards
Searchable, sortable data table
CSV export of filtered results
Clean code + deployment instructions
DATA SOURCES I CAN CONNECT:
CSV / Excel file upload
Local database (SQLite, PostgreSQL, MySQL)
REST API / JSON endpoint
Google Sheets
Pandas DataFrame from any Python source
POPULAR USE CASES:
- Sales and revenue tracking dashboards
- Marketing analytics (campaigns, conversions, spend)
- Sports / betting performance tracking
- Inventory and stock monitoring
- Financial P&L summaries
- Survey and form response analysis
- Operational KPIs for internal teams
Betting bots, odds scrapers and sports data tools that actually work
Languages


