Browse categories
English
$
USD
Connect to your AI
Data Analytics
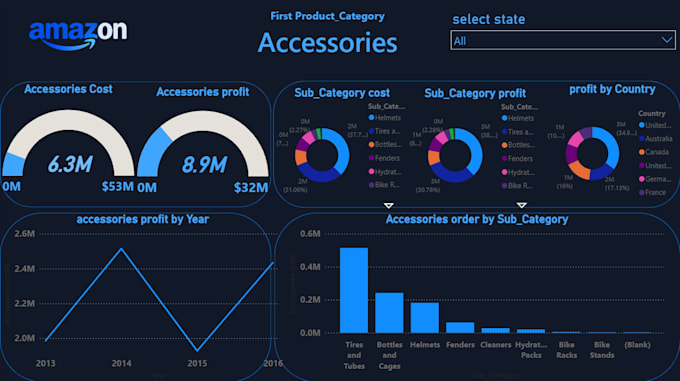
I will help you turn your data into a clear and interactive Power BI dashboard that makes it easier to understand your business and make better decisions.
I will analyze your data, identify important KPIs and trends, and create visualizations that give you clear insights into your business performance.
My goal is not just to create a dashboard, but to help you understand your data, identify opportunities and problems, and make data-driven decisions with confidence.
I can help you with:
Data cleaning and preparation
Data analysis
KPI and metric creation
Interactive Power BI dashboards
Charts, filters, and slicers
Business insights and recommendations
Clear and easy-to-understand visualizations
Let's turn your raw data into useful insights and a dashboard that supports your decision-making.

Technology:
Excel
•
MATLAB
•
Power BI
•
Power Query
Analysis type:
Quantitative analysis
•
Descriptive analysis
Expertise:
Web analytics
•
Business Insights
•
Trends
Programming language:
Python
•
SQL
Tools:
Pandas
•
Microsoft Excel