Browse categories
Explore
Fiverr Pro
English
$
USD
Stop drowning in raw dataturn your numbers into a competitive advantage!
Messy spreadsheets and complex datasets shouldn't hold your business back. I specialize in transforming raw, confusing data into crystal-clear statistical insights and stunning IBM Cognos Analytics dashboards that drive real results.
Whether you need to validate a business hypothesis, uncover hidden trends, or present dynamic KPI visual reports to stakeholders, I deliver clean, reliable, and presentation-ready solutions.
What I Bring to Your Table:
Statistical Power: Regression analysis, hypothesis testing, correlation, and predictive trends.
IBM Cognos Dashboards: High-impact, interactive visual reports and KPI tracking tailored to your metrics.
Data Prep & Cleaning: Structuring messy datasets, fixing errors, and preparing data for flawless analysis.
Actionable Insights: Translating complex statistics into simple, easy-to-read executive summaries.
No confusing jargonjust accurate data, beautiful visual reporting, and fast delivery tailored strictly to your goals.
Ready to bring your data to life? Send me a quick message with your project details, or hit Order Now to get started!



What type of Excel dashboards can you create?
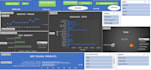
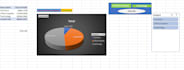
I can create interactive Excel dashboards for sales, finance, marketing, inventory, performance tracking, and other business data.
Can you work with my existing Excel data?
Yes. You can provide your existing Excel/CSV data, and I can clean, organize, analyze, and transform it into an interactive dashboard.
Will the dashboard be interactive?
Yes. Depending on your requirements, I can include PivotTables, PivotCharts, slicers, filters, KPI cards, formulas, and dynamic visualizations.
Can I request specific KPIs or charts?
Yes. You can tell me which KPIs, charts, filters, or business metrics you want, and I can design the dashboard accordingly.
Do you provide the editable Excel file?
Yes. The final dashboard can be delivered as an editable Excel workbook so you can update the data in the future.
What data do you need from me?
Please provide your Excel or CSV dataset and, if possible, explain the KPIs, metrics, or insights you want to track.
Can you customize the dashboard design?
Yes. I can customize the layout, charts, KPIs, colors, filters, and overall dashboard style according to your requirements.
Can you fix or improve an existing Excel dashboard?
Yes. I can help improve the layout, formulas, PivotTables, charts, slicers, formatting, and overall usability of an existing dashboard.


