Browse categories
Explore
Fiverr Pro
English
$
USD


I will clean your Excel or CSV data and create clear charts using R or Python. Get a cleaned CSV, reusable code and a change log so you can understand and repeat the work.
I am a research scientist and bioinformatician with experience in research reporting and reproducible analysis. My approach is practical: check the data, document each change and make the outputs easy to reuse.
Depending on your package, I can:
Standardize column names, dates, categories and missing-value labels
Identify duplicates and inconsistent entries
Create descriptive summaries and clearly labelled charts
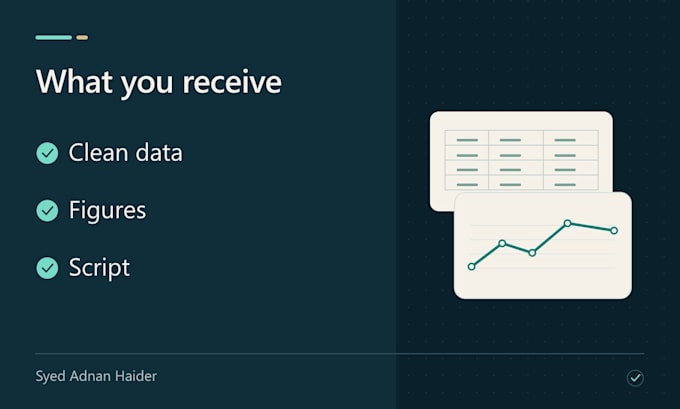
Deliver cleaned CSV files, commented code and a concise change log
Choose bar, line, scatter or box plots in an agreed style and export format.
Please send a sample table and your intended outputs before ordering. Packages cover structured tables and descriptive analysis; advanced modelling, raw sequencing analysis and manual data entry require a separate scope.
See my portfolio for a synthetic data-cleaning example with documented changes, charts and reusable Python code.
Code portfolio: https://github.com/adnanhaider81
Please keep project enquiries and orders on Fiverr.
Research data, scientific editing and portfolio websites
Languages
What types of data can you work with?
Structured CSV and Excel tables, such as research metadata, survey exports and non-identifiable study summaries. Send a small sample so I can confirm the package and cleaning rules.
What are the table and chart limits?
Basic: 1 table, 5,000 rows, 20 columns and 1 chart. Standard: 2 tables, 20,000 total rows, 40 columns per table, 1 join and 3 charts. Premium: 3 tables, 50,000 total rows, 60 columns per table, 2 joins and 5 charts. Joins need supplied keys. Please confirm complex cleaning before ordering.
Will you change or remove observations?
I document changes and flag uncertain values. Decisions that could change the meaning of your data are agreed with you; I do not invent missing measurements.
Is statistical testing included?
These packages cover data cleaning, descriptive summaries and charts. Statistical tests, advanced models and specialist interpretation need a separately agreed scope.
Will I receive the code?
Yes. Every package includes cleaned CSV data, a commented R or Python script, a change log, and each agreed chart in PNG and PDF. Premium also includes a concise HTML report.
What does a revision include?
A revision adjusts the agreed cleaning rules, labels, colours or layout. New datasets, new analyses and additional charts are outside the original package.