Browse categories
Explore
Fiverr Pro
English
$
USD
I will perform professional data visualization and analysis using Python & Power BI to help you gain actionable insights from your data. Whether you need cleaning, preprocessing, visual reports, or deep statistical insights, I've got you covered!
My Services Include:
Data Cleaning & Preparation
Statistical & Exploratory Data Analysis (EDA)
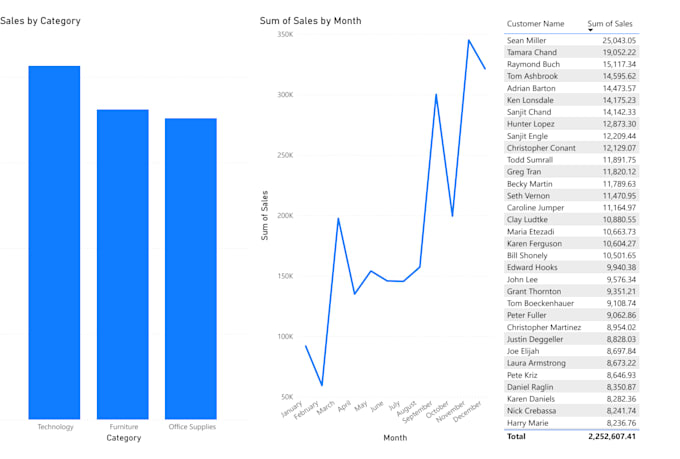
Data Visualization (Power BI, Matplotlib, Seaborn)
Interactive Dashboards & Reports
Predictive & Descriptive Analytics
Regression & Clustering Analysis
Why Choose Me?
️5+ Years of Experience in Data Science & Analytics
High-Quality, Well-Explained Reports
Customized Solutions Tailored to Your Needs
Deliverables: Graphs, Charts, Dashboards, Reports (PDF, Power BI, Jupyter Notebook)
Have specific requirements? Feel free to message me before placing an order!


1️⃣ What do I need to provide before you start?
You need to provide your dataset in CSV, Excel, JSON, or SQL format along with a brief explanation of your requirements.
2️⃣ What if my data is unstructured or needs cleaning?
No worries! I offer data cleaning and preprocessing as part of my service to ensure accurate analysis.
3️⃣ Can you create a fully interactive Power BI dashboard?
Yes! I can build a custom Power BI dashboard with filters, KPIs, and interactive visualizations based on your needs.
4️⃣ Do you offer predictive analysis or machine learning?
Yes! For advanced predictive modeling (regression, clustering, forecasting, etc.), please message me to discuss a custom offer.
5️⃣ What tools do you use for data visualization?
I use Python (Matplotlib, Seaborn, Plotly) and Power BI for creating clear and insightful visualizations.
6️⃣ Can I get my project delivered faster?
Yes! Select the "Extra Fast Delivery" option for quicker turnaround.