Browse categories
Explore
Fiverr Pro
English
$
USD

Level 1

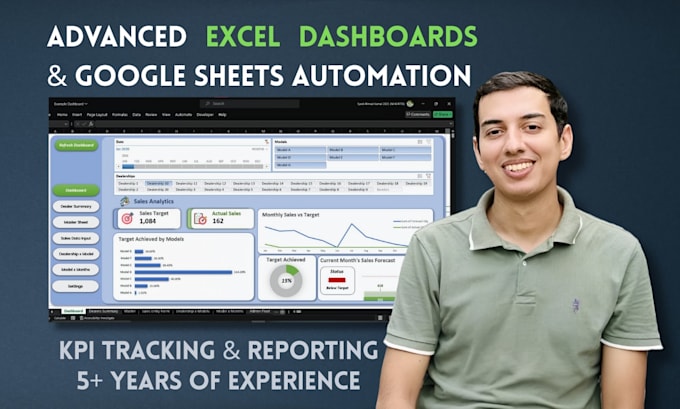
Most Excel dashboards are just tables with colors added. A real dashboard tells you what changed and what needs attention without reading every row.
What you receive:
If your data is spread across multiple sheets, I consolidate it into one clean model before building on top. That is where most self-built dashboards fail and where I spend the most time.
How it works:
Works with Excel 2016, 2019, 2021, and Microsoft 365. Also available for Google Sheets.
Message me with your file before ordering. I will tell you what is possible.
From Messy Spreadsheets to Automated Solutions
Level 1
Languages
Can you automate the data import from a CSV or website?
Yes! Using Power Query in Excel or ImportXML in Google Sheets, I can set up your dashboard to automatically pull in new data, so you don't have to copy-paste manually. (Keywords: Power Query, ImportXML, Automate).
Do you create custom Excel Templates?
Absolutely. I can design a branded Excel Template with your logo and color scheme, ready for your team to use.
What is the difference between a Dashboard and a Report?
A Report is static. A Dashboard is interactive; I use Slicers and Timelines so you can filter the data by year, product, or region instantly.