Browse categories
Explore
Fiverr Pro
English
$
USD
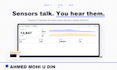
Your sensors already read something useful. Right now no one on the team can see it.
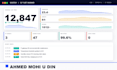
I build Raspberry Pi monitoring stations that pull data from your sensors, push it through NodeRED, and surface it on a Grafana dashboard anyone opens from a browser. No SSH gymnastics, no SD cards in the mail, no broken dashboards at midnight.
What you get
Built on the same stack behind shipped projects
Send your sensor list and what you want to see on the dashboard. I'll send back a wiring diagram and a payback timeline before you order :)

Will this work with my existing sensors?
Yes. Anything that speaks Modbus, MQTT, I²C, SPI, 1-Wire, or USB serial is fair game. Send the make and model and I'll confirm before you order.
Do I need to know NodeRED to keep it running?
No. I ship a one-page runbook with the screenshots you need to restart a flow or swap a sensor. Most clients never open NodeRED again.
Can I see the dashboard from outside the office?
Yes. Premium tier ships with Tailscale or a reverse tunnel, both safer than opening a port on your router.
Does the data leave my building?
Only if you ask. Standard tier runs entirely on your Pi. Premium adds an optional cloud handoff to AWS, Azure, or your own broker.
Do I own the code?
Yes. Full NodeRED flow JSON, Grafana JSON, and any custom scripts are yours after delivery.


