Browse categories
Explore
Fiverr Pro
English
$
USD
FPnA, financial dashboards, forecasting, KPI reporting and business intelligence
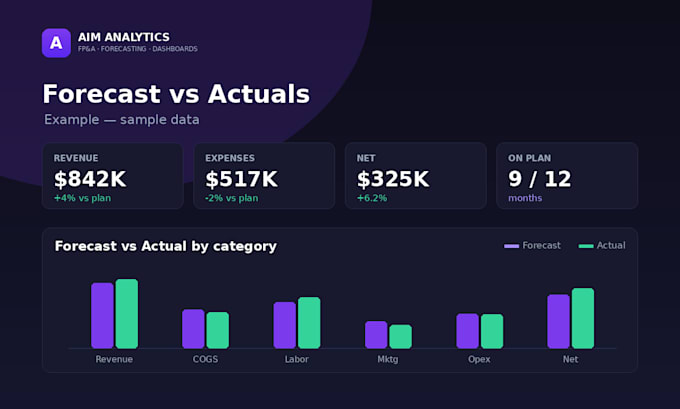
Stop guessing whether you're on plan. I'll build you a single, self-updating Excel system that shows your forecast, your actuals, and exactly where you're ahead or behind with automatic green/red variance flags.
You get a Forecast tab, an Actuals tab, and an Analysis tab that does the math for you. One month picker drives the whole workbook update your numbers once and every view refreshes. No double entry, no stale numbers.
What you get:
Forecast, Actuals & Analysis in one clean workbook
Automatic green/red variance flags so problems jump out
Charts that show where you're ahead or behind
Built to work with your accounting or POS export
Why me: 15+ years in FP&A I build these reporting systems every week, work fast, and keep you updated throughout. Message me and I'll tell you exactly what I need to get started. See examples in the gallery.


How do you get actuals in each month
You paste or import them once; the analysis updates automatically.
Can it cover multiple locations
Yes — that's the Multi-Entity (Premium) tier.
Will it work with my accounting software export?
Yes, I build it around your export format.
Excel or PowerBI
Either; Excel by default, just ask.