Browse categories
Explore
Fiverr Pro
English
$
USD

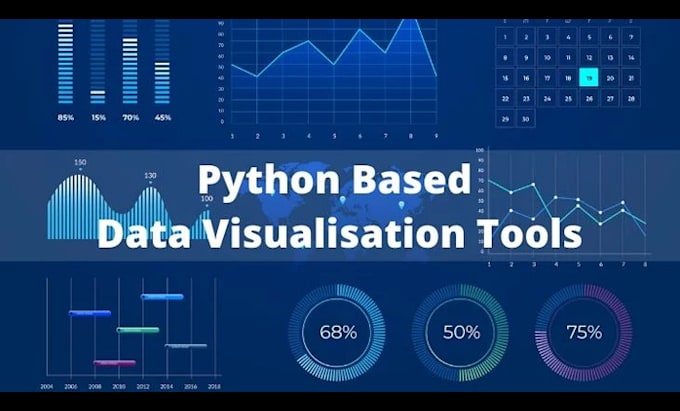
Turn your raw data into actionable insights! As a Full-Stack Developer and Data Specialist, I help businesses and researchers visualize their complex data through professional, clean, and insightful Python-based charts and dashboards.
Whether you have a small Excel sheet or a large database, I will create high-quality visualizations that tell the story behind your numbers.
What I Offer:
Custom Charts: Bar charts, Line graphs, Pie charts, Heatmaps, Scatter plots, and more.
Modern Libraries: Expert use of Matplotlib, Seaborn, and Plotly.
Clean Design: Professional layouts focused on readability and aesthetics.
Data Cleaning: Basic preprocessing of your CSV/Excel files to ensure accuracy.
Detailed Insights: Clear visualizations that highlight trends and patterns.
Why Choose Me?
Engineering Background: Deep understanding of data structures and Python logic.
Fast Delivery: Get your basic charts within 48 hours.
Quality Code: Well-documented Python scripts provided upon request.
Computer Science and Engineering student
Languages
What type of files can I provide for the visualization?
I can work with a variety of formats, including CSV, Excel (xlsx), JSON, and SQL databases. If you have a different format, feel free to message me first!
Which Python libraries do you use?
Depending on the project, I primarily use Matplotlib and Seaborn for static charts. For interactive or more complex visuals, I utilize Plotly or Pandas.
Can you help me clean or organize my data before visualizing it?
Yes, the Basic package includes minor data cleaning. If your dataset is very messy or requires significant preprocessing, we can discuss a custom offer to ensure the final charts are accurate.
Will I receive the source code (Python script)?
Absolutely. I provide the full Python script along with the final image or interactive file so you can see the logic and reuse it in the future.
Do you offer interactive dashboards?
Yes, I can create interactive visualizations using Plotly. If you need a full web-based dashboard, please check my Full-Stack development gig or message me for a custom quote.
Is my data safe with you?
Data privacy is a priority. I only use your data for the duration of the project to create the visuals. Once the order is completed and you are satisfied, I delete your files from my local system