Browse categories
Explore
Fiverr Pro
English
$
USD


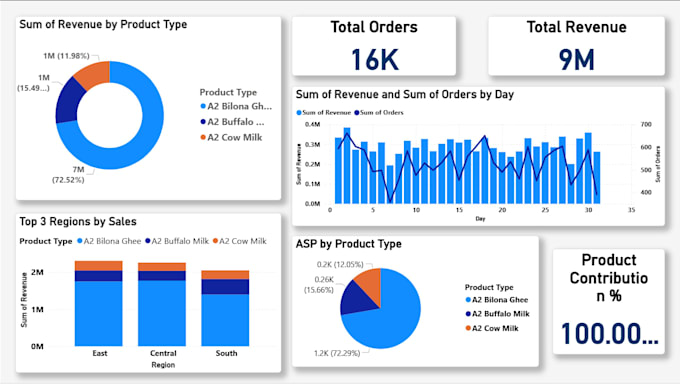
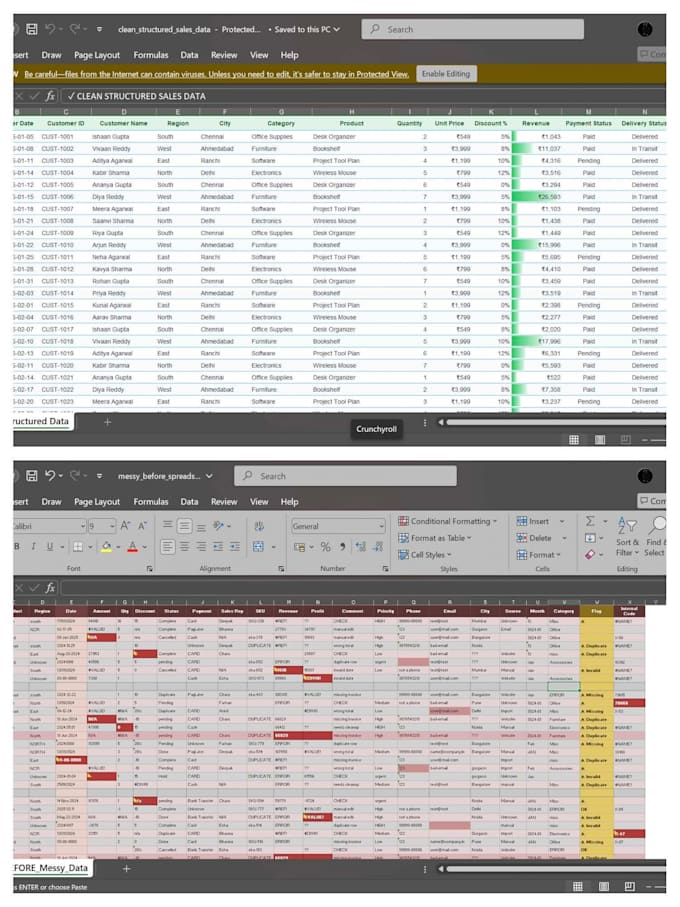
Do you have data sitting in spreadsheets but no way to see the full picture? I'll turn your raw data into a clear, interactive dashboard that helps you make better decisions fast.
What you get:
- Clean, professional dashboard designed for your specific data
- Interactive filters, slicers, and drill-downs (Power BI) or dynamic charts (Excel)
- KPI cards, trend lines, and comparison visuals
- PDF export + source file included
Tools I work with:
Power BI, Excel (charts, pivot tables, Power Query), Google Data Studio
What I need from you:
1. Your raw data file (Excel, CSV, Google Sheets, or database export)
2. A brief description of what you want to track or visualize
3. Any branding preferences (colors, logo) optional
Why work with me:
- Fast turnaround with clear communication
- Structured deliverables, no guesswork
- Revisions included in every package
Message me before ordering if your project is complex I'll send a custom offer.
Languages
What file formats can you work with?
Excel (.xlsx), CSV, Google Sheets, JSON, SQL exports — any structured data format.
Can you connect live data sources?
Yes, for Power BI dashboards I can connect to SQL databases, Google Sheets, APIs, and more. Let's discuss in messages.
I don't know exactly what I want — can you suggest?
Absolutely. Share your data and goals, and I'll recommend the best layout and visuals for your use case.