Browse categories
Explore
Fiverr Pro
English
$
USD



I classify satellite imagery into land cover classes and quantify what changed between dates, with numbers you can put in a report.
WHAT I CAN DO
WHAT YOU RECEIVE
WHY ME
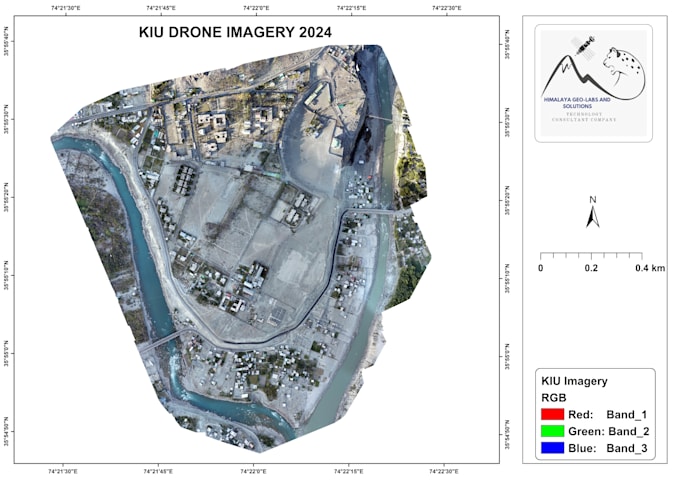
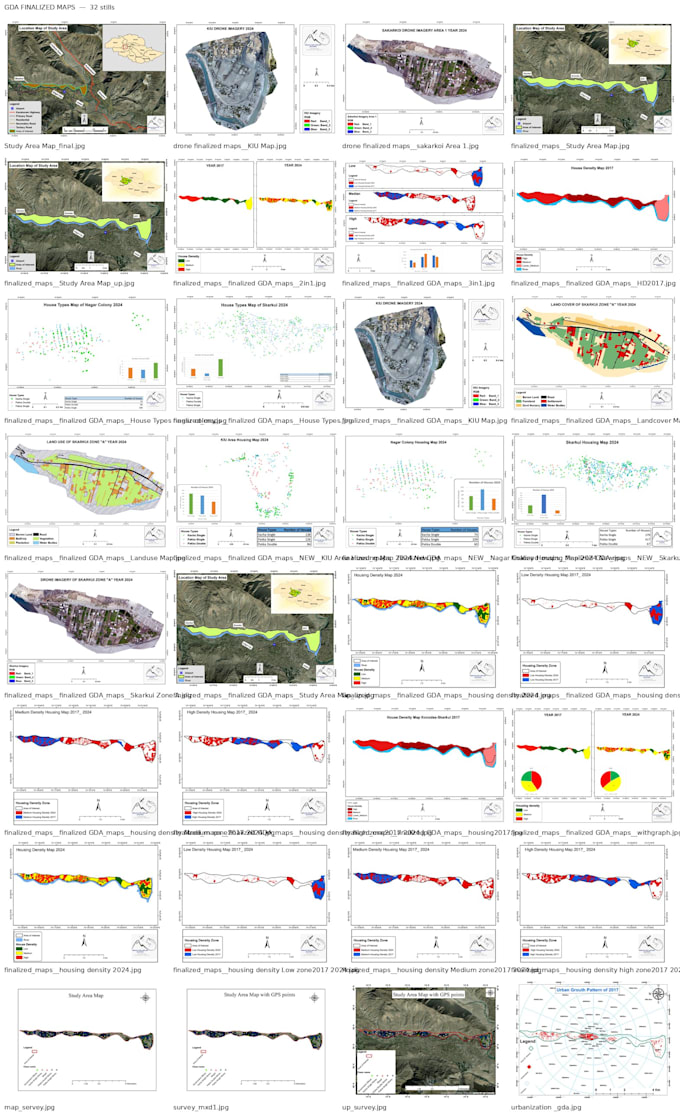
Remote sensing engineer and PhD researcher at Capital Normal University, Beijing. I led an urban growth study for the Gilgit Development Authority: Sentinel-2 change detection, housing density 2017 vs 2024, UAV survey at 3-4 cm and a household survey, delivered as land use, land cover and density maps with a technical report.
Data: Landsat 5-9, Sentinel-2, Planet, UAV imagery. Tools: QGIS, ArcGIS, Google Earth Engine, Python.
Send your area and the years you want compared.
Geospatial Data Scientist
Languages
What accuracy can I expect?
It depends on the imagery, the number of classes and how separable they are. I report the confusion matrix and kappa from real reference points rather than quoting a figure up front. If the data cannot support the class detail you want, I will say so before you order.
How far back can the comparison go?
Landsat covers most of the world from the mid-1980s at 30 m, so comparisons across 30 or 40 years are realistic. Sentinel-2 gives 10 m but only from 2015. Older dates mean coarser pixels, so small features may not be separable.