Browse categories
Explore
Fiverr Pro
English
$
USD
Pakistan
7 orders completed
Data Scientist, PhD in Statistics, R Studio Python PLS Expert
Hello, I am Shah Saud, a PhD in Statistics and Data Scientist with over 6 years of experience in advanced Statistics and Machine Learning. I will provide expert-level services in Factor Analysis, Principal Component Analysis (PCA), and Path Analysis using cutting-edge statistical tools and software.
Services Offered:
1. Factor Analysis (Confirmatory and Explanatory FA, Principal Axis Factoring, Maximum Likelihood, Varimax, Oblimin, Promax Rotation, Cronbach's Alpha, Composite Reliability, Factor Scores Calculation)
2. Principal Component Analysis (PCA) (Data Preparation, Standardization, Eigenvalues and Eigenvectors, Scree Plot, Variance Explained, Component Scores, Biplots)
3. Path Analysis (Structural Equation Modeling - SEM) (Model Specification, Path Diagrams, Maximum Likelihood Estimation, Generalized Least Squares, CFI, TLI, RMSEA, SRMR, Mediation, Moderation Analysis)
Tools and Software:
R Language (psych, factoextra, lavaan, semPlot, ggplot2, R Studio, R Markdown)
Python (numpy, pandas, sklearn, factor_analyzer, semopy, matplotlib, seaborn, Jupyter Notebook, Colab)
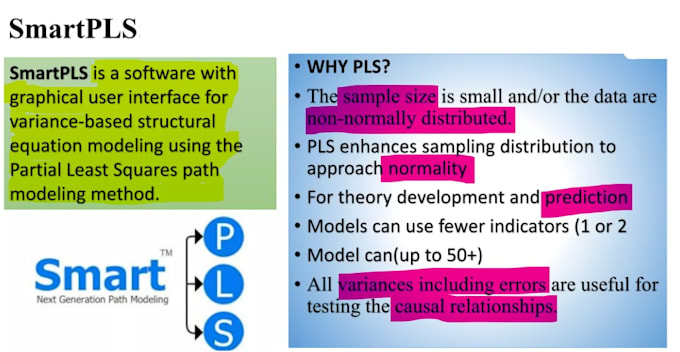
SmartPLS (PLS-SEM, Bootstrapping, SmartPLS 3)
AMOS (AMOS, SEM, Path Diagram)
Let's Do It...

What is Factor Analysis, and how can it benefit my research?
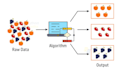
Factor Analysis (FA) is a statistical method used to identify underlying relationships between variables by grouping them into factors. It benefits research by reducing dimensionality, improving data interpretation, and identifying latent constructs.
What types of Factor Analysis do you perform
I perform both Confirmatory and Exploratory Factor Analysis, including Principal Axis Factoring (PAF), Maximum Likelihood (ML) extraction, and rotation methods like Varimax, Oblimin, and Promax.
How do you ensure the reliability of Factor Analysis?
Reliability is ensured using metrics like Cronbach's Alpha and Composite Reliability, along with detailed factor scores calculation and interpretation.
What is Principal Component Analysis (PCA), and when should it be used?
PCA is a technique used to reduce the dimensionality of large datasets by transforming them into a set of uncorrelated principal components. It is used when the goal is to simplify data while retaining as much variance as possible.
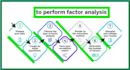
What are the steps involved in PCA?
The steps include data preparation and standardization, calculation of eigenvalues and eigenvectors, creation of scree plots, variance explained analysis, component scores calculation, and biplot visualization.
What is Path Analysis, and how does it differ from other analyses?
Path Analysis, a type of Structural Equation Modeling (SEM), examines the direct and indirect relationships between variables using path diagrams. It differs from other analyses by allowing for the modeling of complex causal relationships.
What tools do you use for Path Analysis?
I use tools such as R (lavaan, semPlot), Python (semopy), SmartPLS (PLS-SEM, bootstrapping), and AMOS (path diagrams, model testing).
How do you ensure the accuracy of Path Analysis results?
Accuracy is ensured through Maximum Likelihood Estimation, Generalized Least Squares, and fit indices like CFI, TLI, RMSEA, and SRMR. Mediation and moderation analyses are also performed for comprehensive results.
Can you explain the statistical software and packages you use for these analyses?
I use R (packages: psych, factoextra, lavaan, semPlot, ggplot2), Python (packages: numpy, pandas, sklearn, factor_analyzer, semopy, matplotlib, seaborn), SmartPLS (SmartPLS 3), and AMOS (AMOS Graphics).
How do you deliver the analysis results, and what support do you offer post-delivery?
Results are delivered in detailed reports with visualizations and interpretations. Post-delivery support includes revisions for accuracy and clarity and assistance with any queries or clarifications.