Browse categories
Explore
Fiverr Pro
English
$
USD
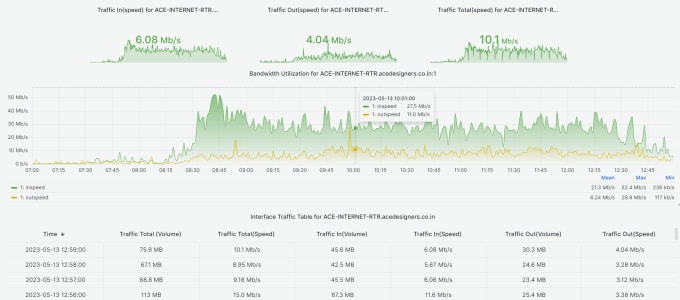
Welcome to my Fiverr Gig where I offer professional and customized Bandwidth utilization dashboard creation using Grafana and Telegraf, with SNMP data collection for your Routers, Switches and Firewalls.
Are you tired of struggling to monitor your network Device Bandwidth utilization? Do you need a powerful, intuitive, and user-friendly utilization dashboard that provides you with real-time insights into your network? Look no further than my Fiverr Gig!
Using Grafana and Telegraf, I will create a customized utilization dashboard for you that is tailored to your specific needs. With my extensive experience in SNMP data collection, you can be sure that the data collected will be accurate and relevant to your network.
You will be able to monitor your network utilization in real-time, with detailed graphs and charts that provide you with clear and concise information. These Graphs are inspired by PRTG interface and it looks exactly the same.
Device:
Server/Hosting
Also delivering:
Remote connection support
•
Documentation