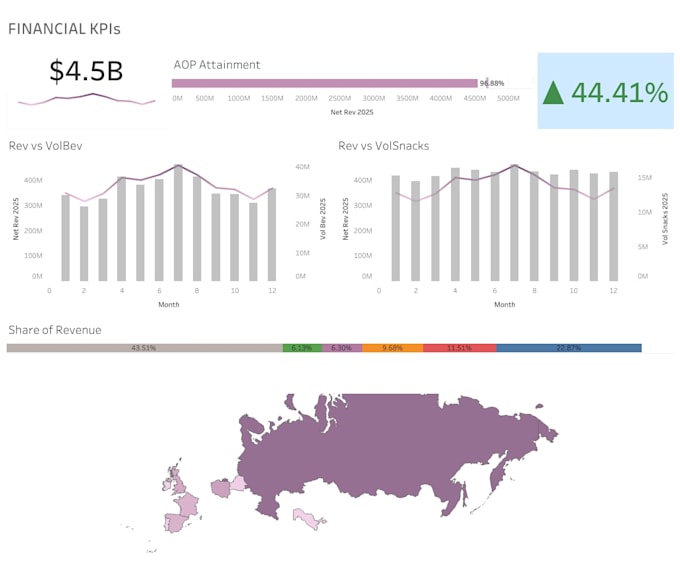
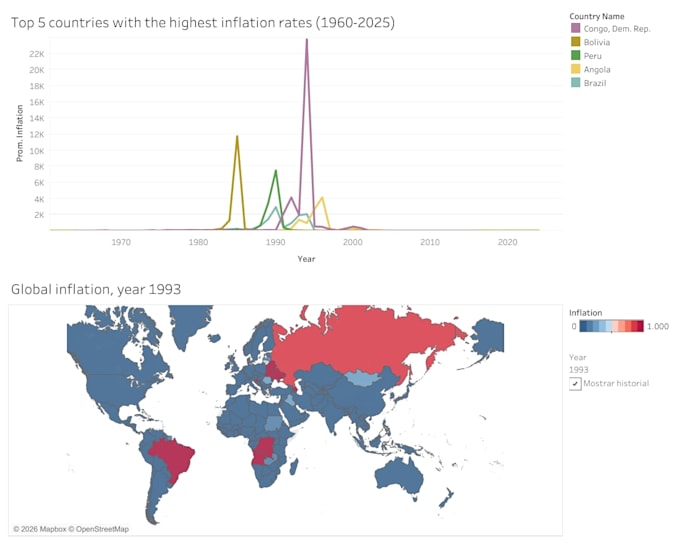
Do you have raw data but aren't sure how to extract its true hidden value? A solid visual analysis is the key to making smart business decisions.
I specialize in transforming your databases into clear, aesthetic, and highly functional visual stories. I use advanced tools for data cleaning, processing, statistical analysis, and the creation of dynamic dashboards.
What does my service include?
- Interactive Dashboard Design: Creation of custom dashboards (Tableau) with a clean and professional interface.
- Advanced Interactivity: Implementation of custom filters, detailed geospatial mapping, and dynamic parameters so you can explore your metrics from different angles.
- Statistical Analysis: If required, I can include hypothesis testing and cross-variable analysis to validate your data before graphing.
Why work with me?
- Highly analytical approach and strict attention to detail.
- Ability to translate complex metrics into easy-to-understand charts.
- Constant communication to ensure the final product perfectly aligns with your business KPIs.
What I need from you:
- Your data (Excel, CSV, SQL, etc.)
- A brief explanation of your business goal or the KPIs you want to measure
- Any visual preferences