Browse categories
Explore
Fiverr Pro
English
$
USD

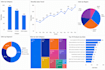
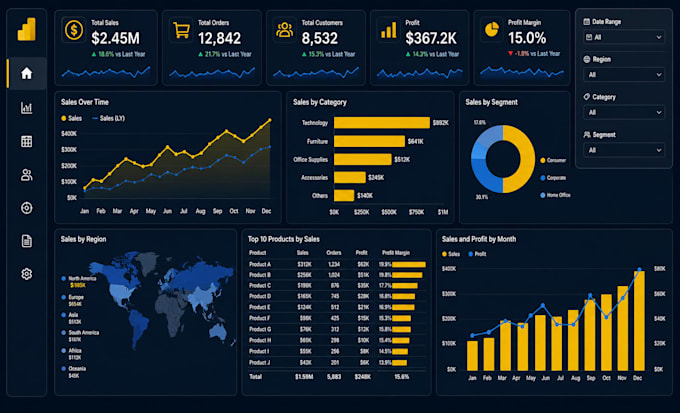
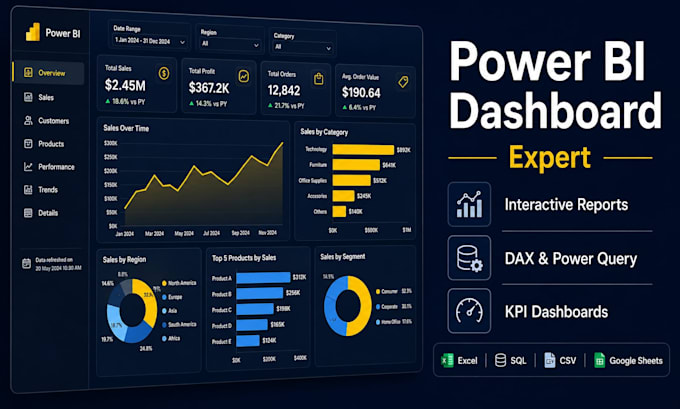
Power BI Dashboard Expert | BI Reports & Data Visualization
Drowning in Excel data? I'll build clean, interactive Power BI
dashboards that turn raw data into real business insights.
WHAT I DELIVER:
- KPI cards, bar, line, pie & map visuals
- DAX measures YoY growth, running totals, % change
- Power Query data cleaning & transformation
- Drill-through filters, slicers & bookmarks
- Multi-page reports with navigation buttons
- Editable .PBIX file included
DATA SOURCES:
Excel | CSV | SQL | MySQL | Google Sheets | SharePoint | API
DASHBOARD TYPES:
Sales & Revenue
Finance & P&L
HR & Attrition
Marketing Analytics
Executive / CEO Summary
eCommerce & Inventory
WHY ME?
Data cleaned before building
Business-focused, not just pretty visuals
On-time delivery guaranteed
Fast replies within 12 hours
Message me before ordering share your data
and I'll suggest the right package for you!
Let's turn your data into decisions.
I will turn your data into easy to read dashboards
Languages
Q1: What files or data do I need to provide?
A: Share your data in Excel, CSV, or Google Sheets format. For database connections (SQL/MySQL), share credentials securely via Fiverr chat. The cleaner your data, the faster I deliver.
Q2: Will I be able to edit the dashboard myself after delivery?
A: Yes! You'll receive the editable .PBIX file. You can open it for free using Power BI Desktop — no paid license needed to view or make basic edits.
Q3: What if my data is messy or unorganized?
A: No problem. I use Power Query to clean, transform, and structure your data before building the dashboard. Basic cleaning is included in all packages.
Q4: How many revisions do I get and what counts as a revision?
A: Basic = 1, Standard = 2, Premium = 3. A revision means changing existing visuals, colors, or layout. Adding a new page or new data source counts as extra work — I'll send a custom offer for that.