Browse categories
Explore
Fiverr Pro
English
$
USD


Are you looking for clean, professional, and easy-to-understand data analysis and visualization?
You are in the right place.
I will help you transform your raw data into meaningful insights using Python, Pandas, NumPy, and Matplotlib. Whether your data is in Excel, CSV, or any structured format, I will clean, analyze, and present it in a visually appealing way.
What I offer:
Data cleaning (handling missing values, duplicates, formatting)
Data analysis using Pandas and NumPy
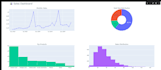
Professional charts and graphs (Bar, Line, Pie, Histogram)
Trend analysis and insights
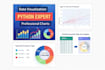
Dashboard-style visual reports
Excel/CSV data processing
Why choose me:
Clean and efficient Python code
Clear and professional visualizations
Fast delivery and good communication
Focus on accuracy and quality work
Packages:
Basic Simple chart with basic cleaning
Standard Multiple charts with analysis and insights
Premium Complete data analysis with dashboard and detailed insights
Important:
Please contact me before placing an order so I can understand your requirements and provide the best solution.
Lets turn your data into clear and powerful insights.
I will turn your data into easy to read dashboards
Languages
1. What type of data do you work with?
I work with Excel, CSV, and other structured data formats. You can share your dataset and I will handle the rest.
2. What tools do you use for data analysis?
I use Python with Pandas, NumPy, and Matplotlib to clean, analyze, and visualize data professionally.
Can you create custom charts based on my requirements?
Yes, I can create bar charts, line charts, pie charts, and other visualizations based on your needs.


