Browse categories
Explore
Fiverr Pro
English
$
USD
Data Entry and Excel Specialist
Are you looking for a professional Excel dashboard, sales report, or business data analysis?
I can help you transform your raw Excel data into clean, organized, and easy-to-understand reports and dashboards.
I specialize in creating Excel reports using Pivot Tables, charts, KPI summaries, filters, and data analysis.
What I can do:
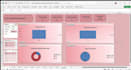
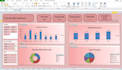
Excel dashboards
Pivot Tables and Pivot Charts
Sales and revenue reports
Profit and quantity analysis
Payment mode analysis
Staff performance reports
Top-selling product analysis
Data cleaning and formatting
KPI summaries and MIS reports
Interactive filters and slicers
What you will receive:
I can work with Excel files such as XLSX and CSV.
Please contact me before placing an order if you have a large or complex dataset.
Let's turn your data into useful business insights!

Platform:
Excel
•
Google Sheets
•
PowerPoint
Development technology:
Power Query
•
Excel
•
VLOOKUP
Expertise:
Formatting
•
Pivot tables
•
Dashboard
•
Power Query
•
Charts
What type of Excel dashboards do you create?
I create sales, profit, revenue, inventory, staff performance, payment analysis, and other business dashboards.
Can you create Pivot Tables and Charts?
Yes, I can create Pivot Tables, Pivot Charts, KPI summaries, and interactive filters based on your data.
Do you work with raw or unorganized data?
Yes, I can clean, format, and organize raw Excel or CSV data before creating reports.
Will I receive an editable Excel file?
Yes, you will receive an editable Excel workbook, unless otherwise agreed.
Can you customize the dashboard design?
Yes, I can customize the layout, colors, KPIs, charts, and report structure according to your requirements.


