Browse categories
Explore
Fiverr Pro
English
$
USD
AI Specialist ML Solutions, NLP, Automation and Web Scrapping
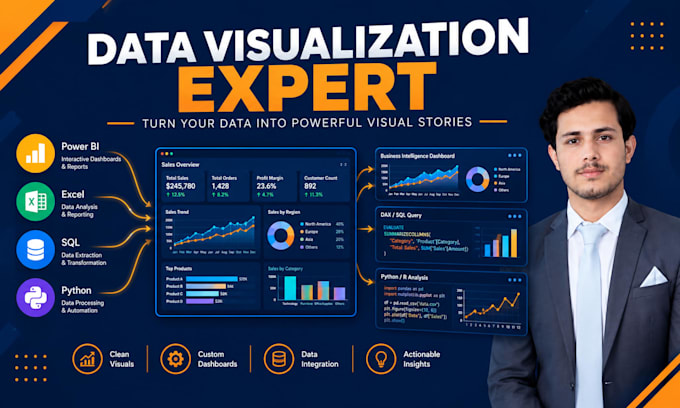
Turn Your Raw Data Into Powerful, Insightful Visualizations
Looking for a Data Visualization expert skilled in Power BI, Tableau, Python, and R? You're in the right place.
I help businesses turn Excel, CSV, SQL, and other data into clear, professional, interactive visualizations using Power BI, Tableau, Python, and R.
What I Offer:
Power BI dashboards with DAX and Power Query
Tableau interactive dashboards and story-driven visuals
Python visualization (Matplotlib, Seaborn, Plotly)
R visualization (ggplot2, Shiny)
Data cleaning, modeling, and statistical analysis
Custom charts, graphs, and KPI reports
Live consultation to discuss your needs
Why Work With Me:
As an AI/ML Engineer and Data Analyst, I bring hands-on expertise in Power BI, Tableau, Python, and R, combining technical accuracy with clean design. Whether you need a Power BI dashboard, Tableau report, Python chart, or R visualization, I deliver insights that support real decisions.
Tools: Power BI | Tableau | Python | R | DAX | Excel | SQL | Data Modeling
Let's turn your numbers into a visual story. Message me before ordering to discuss your project.

Which tool should I choose — Power BI, Tableau, Python, or R?
It depends on your needs. Power BI/Tableau are great for interactive dashboards, while Python/R are ideal for statistical or custom visualizations. I can also recommend the best fit after reviewing your data.
What data formats can you work with?
I can work with Excel, CSV, SQL databases, JSON, and other common data formats across all four tools.
Do I need to provide clean data?
No, you can send raw data — I handle data cleaning, structuring, and modeling before creating visualizations.
Can you combine multiple tools in one project?
Yes, I can use Power BI for dashboards, Python/R for statistical charts, or Tableau for storytelling — whatever fits your project best.
Do you use DAX in Power BI dashboards?
Yes, I create custom DAX measures, calculated columns, and use Power Query for data transformation.
Can you create visualizations using Python or R libraries?
Yes, I use Matplotlib, Seaborn, and Plotly in Python, and ggplot2/Shiny in R for custom and statistical visualizations.
Will the dashboard/visualization be interactive?
Power BI and Tableau outputs include interactive filters, slicers, and drill-downs. Python/R visuals can also include interactive elements using Plotly or Shiny.
Do you provide the source files?
Yes, I provide the editable source file (.pbix, .twbx, .ipynb, or .R script) depending on the tool used.
How many revisions do I get?
Revisions depend on the package — check the pricing tab for exact numbers per package.
Do you offer live consultation before starting?
Yes, all packages include a live consultation call to understand your requirements before I begin work.
