Browse categories
Explore
Fiverr Pro
English
$
USD

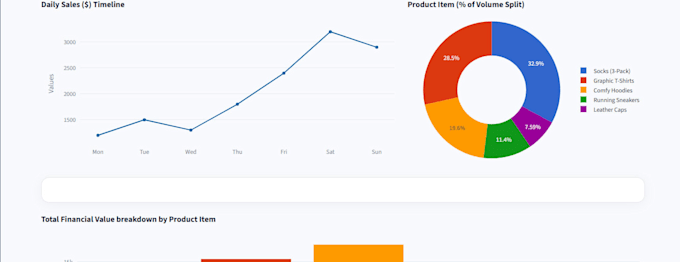
Are you tired of staring at messy, confusing spreadsheets? Lets turn your raw business data into a beautiful, interactive web application that gives you clear, actionable insights at a glance.
I specialize in building custom, high-fidelity dashboards using Python and Streamlit. Whether you run an e-commerce storefront, a local brand, or a service business, I will build a tailored visual tool for your metrics.
WHAT I CAN DO FOR YOU:
OUR STACK:
WHY WORK WITH ME? I am launching this specific gig with highly competitive, introductory pricing because my top priority is building long-term relationships and earning 5-star reviews on my profile. You get premium, custom-coded software engineering at a fraction of the mark
Languages
What file formats do you accept for the data?
I primarily work with CSV, Excel and Google Sheets data. If your data is in a different format, just send me a message and we can easily work out a solution!
How do I run or open the Streamlit dashboard on my end?
I will provide clear, step-by-step instructions to run it locally on your computer using Python. If you want the app hosted live on the web so anyone can access it via a link, I can also help you deploy it to the cloud for free using the Streamlit Community Cloud