Browse categories
Explore
Fiverr Pro
English
$
USD


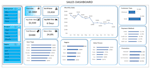
I will create a clear and professional Excel dashboard from your data, with KPIs, charts, tables, and interactive filters. Whether you need a simple dashboard or a more advanced multi-tab report, I will organize your data into an easy-to-understand visual dashboard. I can include trend analysis, comparisons, and a short insights summary to help you understand your results.
What you can expect:
Clean and professional dashboard design
KPI cards and useful charts
Interactive slicers and filters
Trend and performance analysis
Organized Excel workbook
Dashboard tailored to your needs
Please provide your Excel or CSV data and let me know what you want the dashboard to show.
Data Analyst Statistical Engineer
Languages
1. What do you need from me to create the dashboard?
Please provide your Excel or CSV data and explain what KPIs, metrics, or information you want to see.
2. Can you create a dashboard from my existing Excel file?
Yes. I can use your existing data and organize it into a clear, professional dashboard.
3. Can you add interactive filters and slicers?
Yes. Interactive slicers and filters are available with the Standard and Premium packages.
4. Can you customize the dashboard design?
Yes. I can tailor the layout, charts, KPIs, and overall design to your needs.
5. Do you work with large datasets?
Yes. The package you choose determines the amount of data and dashboard complexity included.
6. Can you explain the results?
Yes. The Premium package can include a short insights summary highlighting important trends and findings.
