Browse categories
Explore
Fiverr Pro
English
$
USD


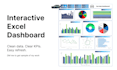
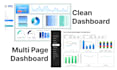

I create professional Excel dashboards that are clean, accurate, interactive, and refresh-ready. Pivot/non-pivot/VBA/non-VBA approach depending on your data. I also support data cleaning, linked sheets, and KPI calculations.
Packages
Unlimited Revision Scope
Please contact me first!
Send a sample file + KPI list + preferred layout to confirm scope and timeline.
Why Me
Experience with Indonesian companies including Pertamina, PLN, Adaro, and MIND ID.
Data Analyst, Designer
Languages
I can’t share the actual dataset. Can you still build the dashboard?
Yes. I only need the data layout (column names, data types, and a few example rows). If you provide anonymized or dummy data, I can build the dashboard to match the structure. After delivery, you can replace it with your real data and refresh.
Can you clean, reshape, or merge multiple sources?
Yes. I can tidy the data, standardize formats, and combine tables/files (e.g., lookups, multiple exports) before building the dashboard. Scope depends on complexity and package.
Will it work in Google Sheets?
If the dashboard relies on Pivot Tables, Power Query, or advanced Excel features, it won’t convert reliably to Google Sheets. If you need a Google Sheets version, you could buy my gigs about G-Sheet Dashboard.
Can you apply my company branding?
Yes. I can match your colors, fonts, and layout style. Share your logo and color codes (HEX/RGB) or a sample template to follow.
I want to include other business metrics in the same dashboard. Is that possible?
Yes. I can integrate additional datasets so project metrics can appear alongside business KPIs (finance, operations, sales, etc.). This is typically best suited for Premium or a scoped add-on.
What do you need from me to begin?
A sample dataset (real/anonymized/dummy), a KPI list with definitions, your reporting frequency (daily/weekly/monthly), and any layout references or examples you prefer.
Can the dashboard update when I add new data?
Yes. I can structure it so you can paste/append new data and refresh to update visuals (Excel Tables + Pivot/Power Query, depending on the build).
Can you improve or fix an existing dashboard/template?
Yes. I can redesign the layout, correct formulas, repair pivots/charts, improve performance, and make the workbook more stable.
Do you include instructions on how to use it?
Yes but as additional service. I can provide a short guide explaining filters, KPI interpretation, and refresh steps. A more detailed PDF guide can be added if needed.
What’s not included by default?
New KPIs or business rules not previously agreed, new datasets added after scope confirmation, and additional pages beyond the selected package (available as add-ons).


