Browse categories
Explore
Fiverr Pro
English
$
USD



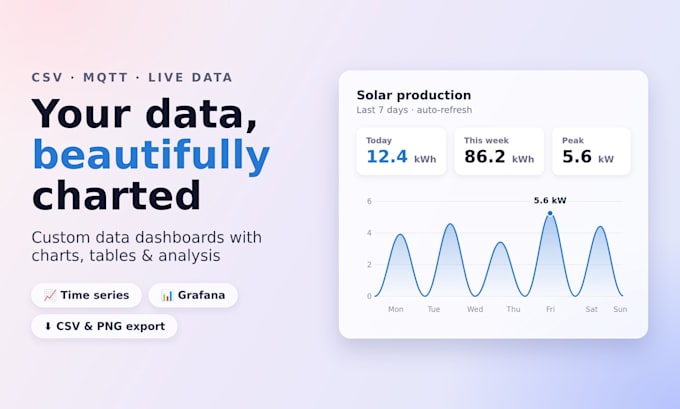
You're collecting sensor data CSV files, MQTT messages, a database but it's just numbers sitting there? I turn it into a clean web dashboard with charts, tables and real analysis you can actually read.
I combine modern, efficient development with hands-on hardware experience from 10+ real builds. I've built MQTT dashboards and energy-monitoring frontends for my own systems, so I know real sensor data, not just demo CSVs.
What I build:
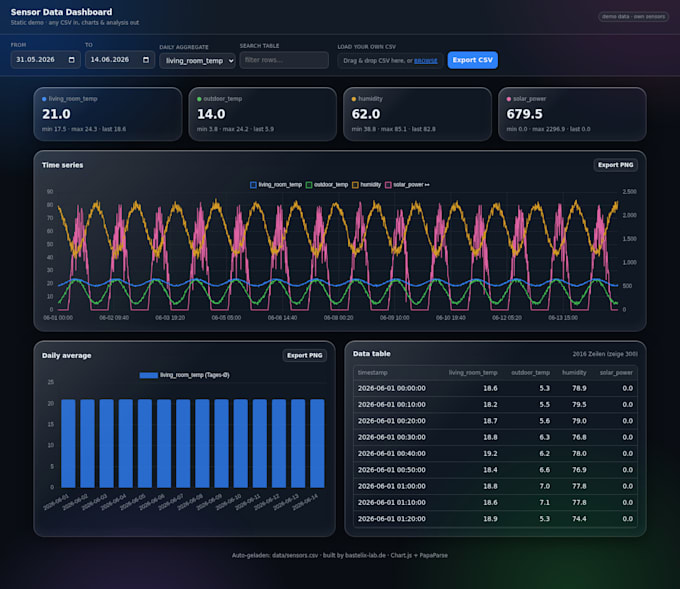
- Interactive charts (line, bar, heatmap, gauge) with Chart.js / ECharts / Plotly
- Tables with filter, search, sort
- Min/max/avg, daily/monthly aggregation, trends, comparisons
- Time-range picker, export to PNG / CSV / PDF
- Responsive layout + dark mode
- Static page OR live dashboard pulling MQTT / InfluxDB / SQLite (see packages)
You get: complete project, commented code, setup guide, post-delivery support.
Need firmware to log the data first? Check my ESPHome gig. Use Home Assistant? See my HA dashboard gig.
Send a data sample before ordering. Hobby use only, not safety-critical. Based in Germany, reply <24h.
ESP32 ESPHome Home Assistant IoT
Languages
What data formats can you work with?
CSV, JSON, log files, MQTT streams, InfluxDB, SQLite, and most REST APIs. Send me a sample and I'll confirm before you order.
Static page or live dashboard — what's the difference?
Basic/Standard deliver a self-contained web page from the data you send (one-time). Premium is a live dashboard that keeps pulling MQTT or a database and updates itself.
Do I need a server to run it?
No for Basic/Standard — it's a single HTML/JS page you can open or host anywhere. Premium includes a small server (Python/Node) and I help you deploy it (Docker, Raspberry Pi or NUC).
Can it run on my Raspberry Pi / local network only?
Yes. Everything can run fully offline / local. No cloud required.
Can you also collect the data for me?
Not in this gig — this is the visualization side. If you need a device or logger that produces the data, see my ESPHome firmware gig.
I already use Home Assistant — should I order this or your HA gig?
If you mainly want to control devices and have nice live cards in HA, go for my HA dashboard gig. If you want to analyze historical data and build reports, this gig is the right one.
What if my data is messy?
I handle parsing, cleanup and reformatting as part of the work. Just tell me what the columns mean.