Browse categories
Explore
Fiverr Pro
English
$
USD

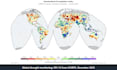
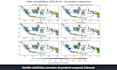
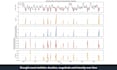

Every drought starts as a number that nobody checked in time.
I am an agricultural meteorologist and certified GISP. For nearly 20 years I have turned satellite and station records into drought and flood early warning for the UN World Food Programme and the World Bank, and I maintain open-source tools for climate indices.
What I can analyse:
- Drought indices such as SPI, SPEI and EDDI, from 1 to 72 months
- Rainfall anomaly, dry and wet spells, extreme rainfall
- Drought and wet events: duration, magnitude, intensity and frequency
- Flood likelihood and exposure of people and cropland
- Satellite rainfall checked or corrected against rain gauges
- Temperature anomaly and long-term trends
How I work:
- We agree the indicators, period and data source before any processing
- Every step is scripted, so results can be checked and rerun
- You get an honest note on what the data can and cannot say
You receive maps, charts, gridded data (NetCDF or GeoTIFF), tables and a method note. Higher packages add slides, event statistics and a reusable Python or Earth Engine workflow.
Every project differs in data, method and output, so message me for a custom offer.
Exploring Climate with GIS and Data Science
Languages
Which climate indices can you calculate?
SPI, SPEI, EDDI, rainfall anomaly, consecutive dry and wet days, extreme rainfall thresholds and temperature anomaly. These are examples: if your index is not listed, tell me and I will check whether the data supports it.
Which climate datasets do you use?
Open global records such as CHIRPS, IMERG, ERA5-Land and TerraClimate, or station data you provide. I choose by resolution, record length and region, and explain the choice in the method note.
Can you use my own weather station data?
Yes. Station records can be analysed on their own, used to check how well satellite rainfall performs in your area, or used to correct its bias.
Which package should I choose?
Basic for one indicator in one area. Standard for several indicators with trends and extremes. Premium for a full risk study with event statistics, exposure and a workflow you can rerun.
Are the package prices fixed?
No, they are a starting point. The real scope depends on your data, the method and the outputs you need. Message me with the details and I will send a custom offer that fits your project.
Can you forecast drought or project future climate?
This gig focuses on observed history and near real-time conditions. Short-range rainfall forecasts can be added where open forecast data exists. For long-term climate projections, message me first to check the scope.
What files will I get?
Maps and charts as PNG or PDF, gridded data as NetCDF or GeoTIFF, and tables as CSV or Excel. Ask if you need another format, grid or coordinate system.
Can you help with my thesis or research project?
Yes, with the analysis and a clear method note you can learn from and cite. The writing and the academic judgment stay yours.
Is my data kept confidential?
Your data is used only for your order and is never shared. If you ask, I delete it after delivery.


