Browse categories
Explore
Fiverr Pro
English
$
USD

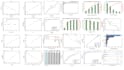


Data visualisation is a skill, a way to give your numbers a voice, and it aids in the analysis and interpretation of valuable information. Refining your work, making it more polished and detailed in order to communicate what you want correctly.
Depending on the research context, several types of graphs can be used based on the data collected such as:
Basic 2D Plots
Statistical Plots
Contour, Heatmap & Image Plots
Fitting & Analysis Graphs
If you need to draw one of these graphs, I can help you draw it accurately and professionally, following the model you want. I could also draw professional 3D graphs for you, I could perform linear and non-linear regression for you according to the desired.
Doctor in process engineering
Languages


