Browse categories
English
$
USD
Connect to your AI

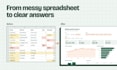
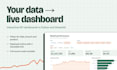
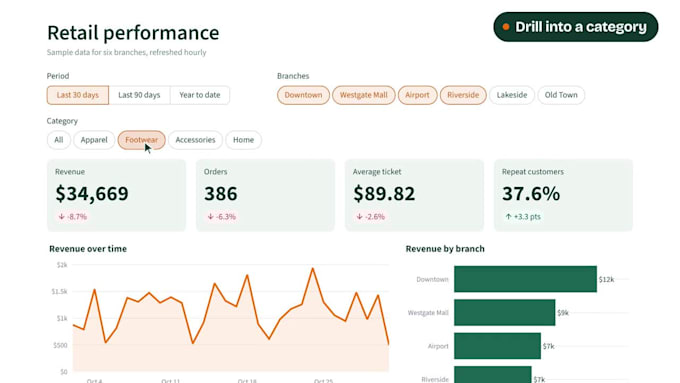
Your numbers live in spreadsheets, exports and databases. I turn them into one clean, interactive dashboard your team opens in a browser.
I build dashboards in Python and Streamlit that load your data, clean it, and show the KPIs that matter: sales by branch or product, stock levels, customer retention, team performance. I built a live executive dashboard for a multi-country retail business that pulls sales, dispatch, production, stock and customer data in real time.
What you get:
Data I connect to: CSV, Excel, Google Sheets, PostgreSQL, Odoo and REST APIs.
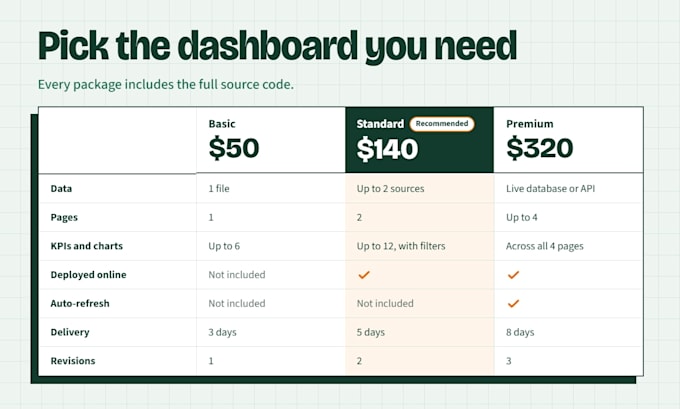
Before ordering, message me a sample of your data and the 3 to 5 questions the dashboard must answer. I'll confirm the right package so there are no surprises.
The Analyst
Languages
Do I need to know Python to use it?
No. You open a link in your browser. The source code is included if your team wants to extend it later.
Can you build it in Power BI or Tableau instead?
Yes, message me the specifications and leave the rest to me
Where is the dashboard hosted?
Cloud (free) or your own server or cloud account. I'll set it up and hand over accesWhere is the dashboard hosted?s.
Is my data safe?
I use your data only for your project, delete my copies after delivery, and can work from an anonymised sample.