Browse categories
Explore
Fiverr Pro
English
$
USD
Managing hundreds or thousands of technical documents and drawings across multiple disciplines shouldn't mean digging through folders and outdated spreadsheets.
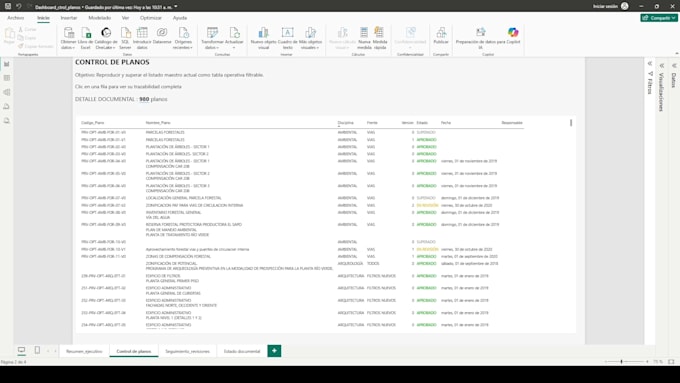
I build Power BI dashboards connected to Excel that give you a real-time, visual control of your entire document universe: approval status, revision history, bottleneck detection, and full traceability all in one place.
With 22 years of hands-on experience in engineering and QA/QC coordination, I don't just build a dashboard that looks good I build one that reflects how real projects and real documentation actually work.
What you'll get:
A Power BI dashboard connected to your Excel/data source
Clear KPIs: total documents, approved/rejected/in review, % objected
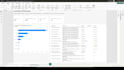
Visual breakdown by discipline, status, and revision cycles
Full traceability and filterable tables
Clean, professional design ready to present to stakeholders
Who this is for: engineering firms, construction companies, project managers, and QA/QC teams handling large volumes of technical documentation.
Let's turn your document chaos into a clear, 15-second read of your project's status.


Programming language:
SQL
•
Other
Technology:
Excel
•
Power BI
Expertise:
Business Insights
•
Anomaly detection
Tools:
Microsoft Excel
Do I need Power BI installed to use the dashboard?
No. I can deliver it as a Power BI file (.pbix) for editing, and/or a published report link you can view from any browser.
What do you need from me to get started?
Your current Excel file or document list — even if it's messy, I'll clean and structure it for you.
Can you customize the dashboard to my specific categories or disciplines?
Yes, all dashboards are tailored to your project's real structure and terminology.
How long does delivery take?
Basic: 4 days | Standard: 7 days | Premium: 10 days, including the training session.