Browse categories
English
$
USD
Connect to your AI
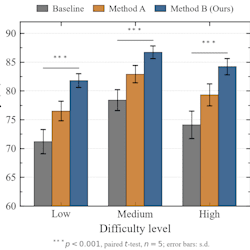


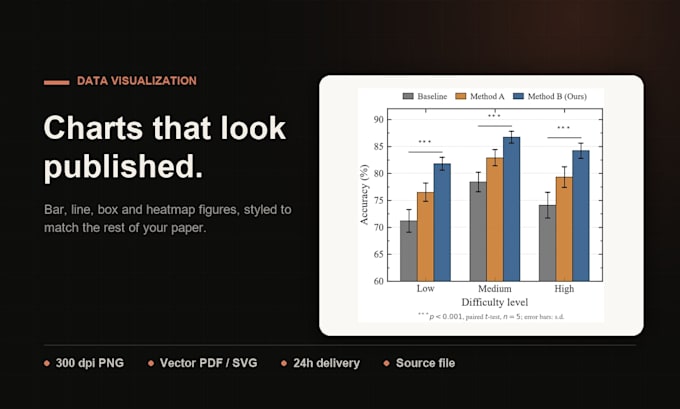
Already have the data, but your figure still looks like a draft?
I design clean, consistent, publication-ready charts - the kind that let a reader understand your result in three seconds.
WHAT I DRAW
- Line, bar, scatter, box and violin plots, with error bars or shaded confidence bands
- Heatmaps, confusion matrices, correlation matrices
- Multi-panel figures (2x2, 1x3) with (a)(b)(c) labels
- Flowcharts, technical roadmaps and model diagrams
- Dual Y-axis, broken axis and annotated trends
WHAT YOU GET
- 300 dpi PNG ready for submission systems
- Vector PDF and SVG that stay sharp at any size
- The source script and data table, so you can re-edit later
- Consistent colours, fonts and line weights across every figure
- 2 to 5 revisions depending on the package
HOW IT WORKS
1. Send your data (Excel or CSV) or a rough sketch.
2. I confirm the figure type and the delivery time.
3. You receive the first version within 24-48 hours.
4. We refine until it reads clearly.
I only design and beautify figures. I never change your data, your statistics or your conclusions.
Not sure if your idea can be drawn? Message me with the data - I will tell you for free.
Please inform the freelancer of any preferences or concerns regarding the use of AI tools in the completion and/or delivery of your order.
Data visualization , academic figure design
Languages
Can you work from a screenshot or an old chart?
Yes. Send the old chart plus the data if you have it. If there is no data file, I can rebuild the figure from a clear table or from the numbers visible in the image.
Do you follow journal formatting rules?
Yes. Tell me the requirements: single or double column width, font family, minimum font size, colour or greyscale, and file format. I follow the journal guide for your target.
What do I receive?
A 300 dpi PNG, a vector PDF or SVG, the source script and the data table. Colours, fonts and line weights stay consistent with your other figures.
Can I get an editable source file?
You get the Python script and data table, so the figure can be re-edited later. I do not provide Illustrator or Photoshop files.
How fast is delivery?
Most single charts are delivered within 24 hours, a set of three within 48 hours. Rush delivery is available as an extra.
Do you write the text or analyse the data?
No. I only design and beautify the figure. I do not modify your data, run statistics or write any part of your text.