Browse categories
Explore
Fiverr Pro
English
$
USD
Delivering insights through Machine Learning, R, Python, and Power BI
Level 1
Has met certain performance criteria and shows strong potential in the marketplace.
I specialize in turning raw data into clean, meaningful, and actionable insights using Excel and Python (Pandas, Matplotlib, Seaborn). Whether you're a business owner, student, or researcher, I help you make data-driven decisions with confidence.
What I Can Do For You
Data Cleaning & Preparation
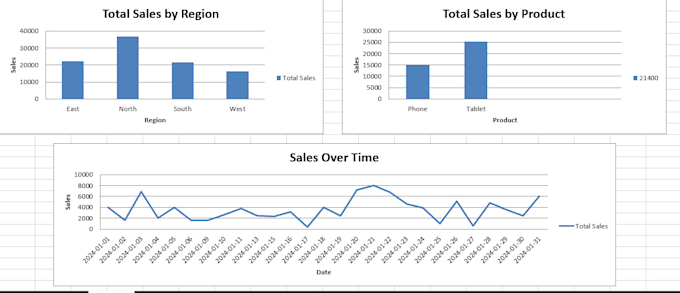
Exploratory Data Analysis (EDA)
Excel-Based Services
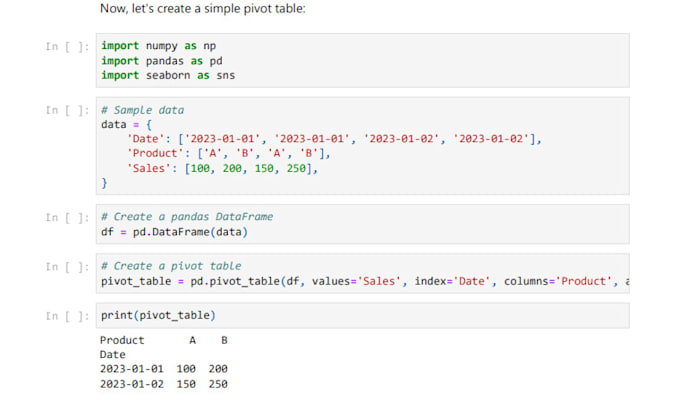
Python-Based Analysis
Deliverables
Why Choose Me?
Fast & accurate delivery
Professional & clean visual outputs
Custom solutions based on your goals
Step-by-step explanation (if needed)

What do you need from me to get started?
I need your dataset (Excel, CSV, or Google Sheets), plus a short description of your goal or problem.
What tools do you use for data analysis and visualization?
I use Microsoft Excel and Python (Pandas, Matplotlib, Seaborn) for cleaning, analysis, and visualization.