Browse categories
English
$
USD
Connect to your AI
Data analyst turning messy spreadsheets into clear dashboards and insights
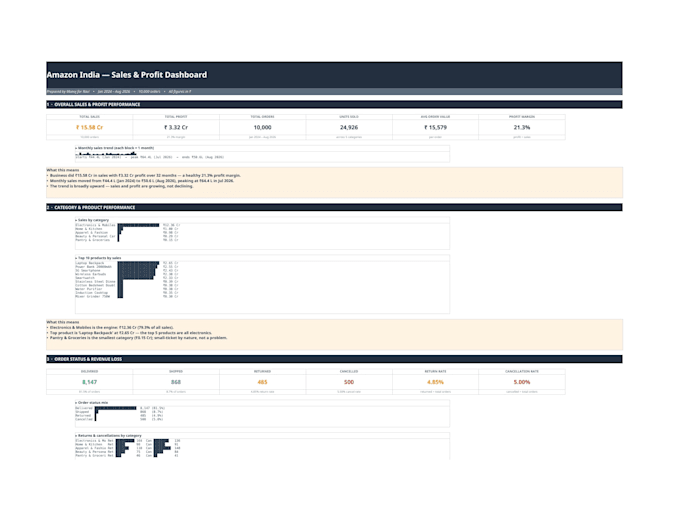
I turn messy spreadsheets into clean, interactive Excel dashboards you can actually use KPI cards, slicers, pivot charts, and one-click filters.
What you get:
Cleaned and structured data
Interactive dashboard sheet with slicers and charts
Pivot tables behind the scenes so numbers stay traceable
Short notes on how to update it with new data
What I need from you: your data file (Excel/CSV) and 2-3 lines on what you want to track.
I build dashboards the way analysts actually use them no bloated templates, everything labeled and updateable. Need the numbers crunched too? Check my profile I also do Python data analysis and ATS resume rewrites.

Analysis type:
Descriptive Analysis
Expertise:
Business Insights
Technology:
Excel
Programming language:
DAX
What format should my data be in?
Excel or CSV; messy is fine, cleaning is included.
Can you work with Google Sheets?
Yes — mention it in the order.
Do you use macros/VBA?
Only if you ask; default is formula + pivot based so it never breaks.
