Browse categories
Explore
Fiverr Pro
English
$
USD

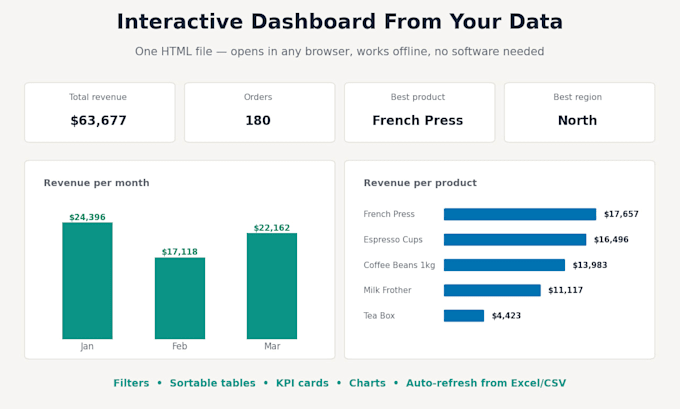
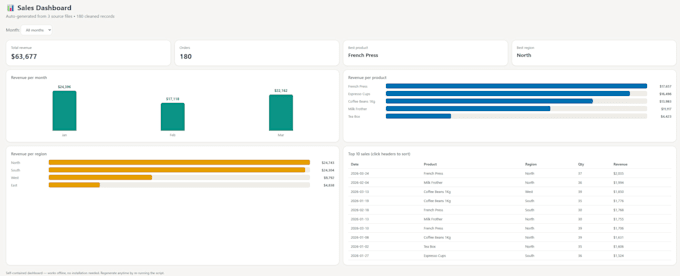
Turn your spreadsheets into a BEAUTIFUL interactive dashboard - one HTML file that opens in any browser.
No Power BI license. No Tableau subscription. No installation. Double-click the file and see your KPIs, charts and tables - with live filters and sorting. Works offline, your data never leaves your computer.
WHAT YOU GET:
- KPI cards (totals, averages, best performers)
- Interactive charts (bar, line, pie - filterable by month, region, category)
- Sortable data tables
- Clean modern design (light or dark theme, your brand colors possible)
- A refresh script: drop in next month's file, run one command, done
PERFECT FOR:
- Monthly sales / revenue reporting
- Small business KPI tracking
- Team or project status overviews
- Turning messy exports into clear insights
HOW IT WORKS:
1. Send your Excel/CSV file(s) and tell me what you want to see
2. I clean the data, build and test the dashboard on your real files
3. You receive the HTML dashboard + refresh script + simple instructions
Your data stays confidential and is deleted after delivery.
Want an example first? Message me for a live demo file you can open in your own browser. No strings attached.
Excel and data automation
Languages
Do I need any software to view the dashboard?
No — that's the whole point! It's a single HTML file that opens in any browser (Chrome, Edge, Safari). No licenses, no accounts, works offline.
Can I update the dashboard myself when I get new data?
Yes. Standard and Premium include a refresh script: put your new Excel/CSV file in the folder, run one command, done. No coding needed.
Can I share the dashboard with my team?
Yes — just send them the HTML file, or put it on a shared drive. Everyone can open it, no accounts needed.
Is my data safe?
Completely. The dashboard runs 100% locally in your browser — your data is embedded in the file and never sent anywhere. I delete your files after delivery.
My data is messy / spread across many files. Is that a problem?
Not at all — cleaning and merging is included (Standard and up). Messy data is my specialty.