Browse categories
Explore
Fiverr Pro
English
$
USD
Python Developer for Trading Bots, Backtests and Vector Logo Redraws
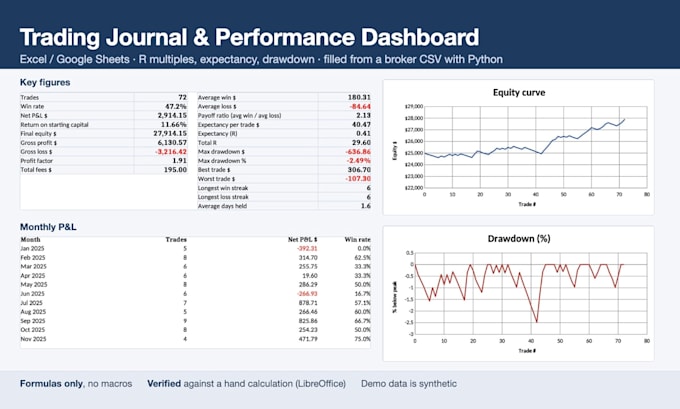
Your trades are in a broker export and your stats are in your head. I build you a journal in Google Sheets or Excel that turns every trade into the numbers that matter, and keeps working after I hand it over.
What you get
The gallery shows sample projects with synthetic trades.
Free price sources can be delayed: I tell you which one I use and how fresh it is.


Platform:
Excel
•
Google Sheets
Development technology:
Google Apps Script
•
Python
•
Excel
Expertise:
Formatting
•
Formulas
•
Dashboard
Excel or Google Sheets?
Either. The formulas work in both; the live watchlist needs Google Sheets.
Which brokers can you import?
Any broker that exports trades as CSV. Send me a sample export (you can remove account numbers) and I map its columns.
Can I change it later?
Yes. Every formula is visible and named, and the guide explains where to add columns.