Browse categories
English
$
USD
Connect to your AI

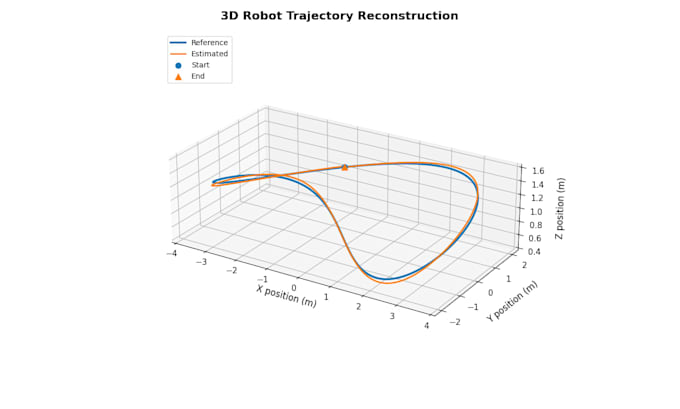
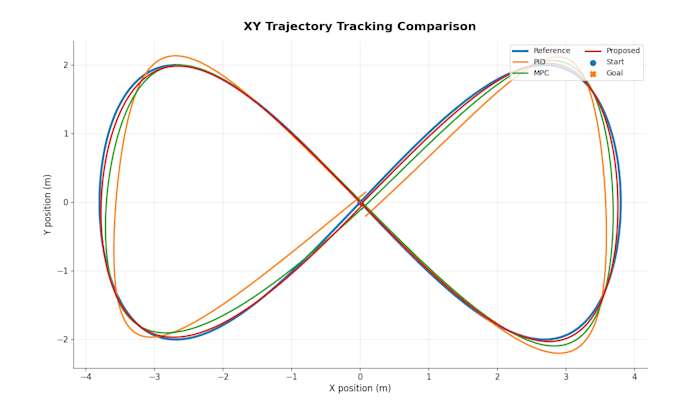
Need clear scientific plots from your research or engineering data? I create clean, publication-style visualizations using Python and Matplotlib.
Services include:
Package details:
To get started, please provide your data, column descriptions, X/Y variables, units, preferred plot type and any reference style. I will confirm the scope before starting.
I communicate primarily through Fiverr messages. Complex statistical analysis, extensive data cleaning, interactive dashboards and web embedding require a separate scope.
Python Developer , Robotics Researcher
Languages
What data formats do you accept?
I primarily accept CSV and Excel (.xlsx) files. Please include column names, variable descriptions, and measurement units whenever possible.
Can you clean or preprocess my raw data?
Basic includes plotting from clean data. Standard includes light formatting, while Premium includes basic data preparation. Extensive cleaning or complex statistical processing requires a separate quote.
Can you create figures for academic journal submissions?
Yes. I can create clean, journal-style scientific figures with consistent typography, labels, units, and export formats. Please provide the journal's figure guidelines if available.
Can you visualize robotics and experimental data?
Yes. I can visualize robot trajectories, tracking errors, time-series measurements, and algorithm performance data. Please provide structured data and explain the variables.