Browse categories
Explore
Fiverr Pro
English
$
USD
Expert Python Developer and AI Automation Specialist
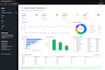
Turn raw, messy data into a clear, decision-ready dashboard not just
pretty charts.
Services:
I deliver working, commented code + a short written summary of what the
numbers actually mean for your business not just a chart dump.
Send me your dataset (or a sample) and the specific question you need
answered, and I'll confirm scope before you order.

Q: How large a dataset can you handle?
A: Millions of rows with pandas/SQL; for very large datasets, Premium uses DuckDB or chunked processing for speed.
Q: Do I get the source code?
A: Yes. Full Python scripts/notebook plus a "README" for every tier.
Q: Can the dashboard update automatically?
A: Yes, Premium includes a scheduled refresh so the dashboard stays current without manual re-uploads.
Q: What tools do you use?
A: Python (pandas, plotly, matplotlib), Streamlit or Dash for the interactive layer, and SQL for database sources.
Q: Can you connect to my live database instead of a file?
A: Yes, that's included from Standard upward. Just share the connection details securely once we start.
