Browse categories
Explore
Fiverr Pro
English
$
USD


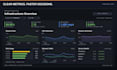

Need a Grafana dashboard that is clear, useful, and easy to operate?
I will turn your existing data source into a focused Grafana dashboard for monitoring, operations, or business KPIs.
I can build panels, variables, filters, thresholds, transformations, links, and a consistent visual structure.
This Gig is ideal when your data source already exists and you need the visualization layer done properly. Dashboard JSON/export is included.
Please message me before ordering if you need a new data source, SSO, custom plugins, complex alerting, or infrastructure changes.
IT Monitoring, Data Automation and Custom Tools
Languages
Do you need access to my Grafana instance?
Usually yes. Alternatively, you can provide an exported dashboard together with sample data or query information. Temporary least-privilege access is preferred.
Which data sources can you work with?
I can work with common Grafana-compatible sources such as Prometheus, SQL databases and InfluxDB when the source is already available. Please contact me first for unusual sources.
Can you connect a new data source?
Yes. A straightforward supported data source can be added as an Extra. More complex integrations require a custom offer.
What counts as a revision?
A revision covers changes within the agreed dashboard scope, such as layout, labels, thresholds or query adjustments. New panels, dashboards or data sources are additional scope.
Do I receive the dashboard source?
Yes. I provide the Grafana dashboard JSON/export where applicable.
Can you improve an existing Grafana dashboard?
Yes. I also offer a dedicated Grafana optimization service for existing dashboards.
Do you install Grafana and Prometheus?
Not as part of this Gig. This service focuses on dashboard design and visualization. Monitoring-stack setup is available separately.


