Browse categories
Explore
Fiverr Pro
English
$
USD


HI! Greeting,
Struggling to make sense of messy raw data or manual spreadsheets? Lets automate your business and transform your datasets into professional, interactive visual ecosystems.
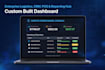
I will build custom, high-performance automated Python scripts that process your data and output stunning, programmatic multi-tab Excel workbooks alongside sleek, dynamic interactive dashboards.
What I Offer:
* Automated Python Pipelines: Raw data processing, cleaning, and CSV parsing (Pandas & OpenPyXL).
* Multi-Tab Ledgers: Deep cross-sheet references, custom conditional formatting, and formulas (SUMIFS, VLOOKUP, INDEX/MATCH).
* The Big 8 Visualizations: Elegant, automated in-sheet and web-based Bar charts, Line charts, Pie charts, Histograms, Scatter plots, and Relationship networks.
* Interactive UX: User dropdown filters, custom KPI summary cards, and outline grouping for parent-child hierarchies.
Why Choose Me?
* Production-grade, optimized Python code.
* Business-centric UI styling (Midnight Slate or custom themes).
* Clear communication and fast deployment.
Please drop me a message before ordering to discuss your custom project specifications, data sources, and design requirements!
Python and AI Automation for Real Businesses
Languages
Do I need to have Python installed to run the automation scripts?
Not at all! I can compile the Python script into a simple, single-click executable file (.exe) for Windows or macOS. You will be able to run the automatic scraper or data processor without ever touching or installing a single line of code.
Will the charts and formulas in the Excel sheets update automatically?
Yes! All the mathematical formulas (like =INDEX(), =MATCH(), =SUMIFS()), dynamic dropdown validation lists, conditional styling, and native charts are fully programmatic. The moment new data is processed or added to the spreadsheet, every chart and KPI card updates instantly.
Can your Python scripts scrape and process live data into the dashboard?
Absolutely. I specialize in building data pipelines that pull live data from e-commerce platforms, APIs, WebSockets, or social streams, format it using Pandas, and automatically inject it into your custom, styled dashboard layouts.
What formatting themes do you offer for the dashboards and ledgers?
A: I offer professional, business-grade styling. My default is a modern "Midnight Slate" dark theme (similar to premium corporate software suites), but I can completely customize the gridlines, fonts, and hex color codes to align with your personal brand guidelines.
Can you build hierarchical relationship maps or network trees in Excel?
Yes. In Excel, I structure hierarchical topologies using data grouping (which allows you to expand and collapse rows with simple [+] and [-] side-buttons) or clean parent-child edge lists. For highly complex networks, I build an interactive web-based topology map using lightweight frontend engine
What files will I receive upon project delivery?
Depending on your selected package, you will receive the fully documented, clean Python source code (.py), any required operational templates, and the generated custom .xlsx Master Workbook containing all automated sheets, charts, and interactive controls.
Can we sign an NDA (Non-Disclosure Agreement) before I share my data?
Yes, absolutely. I take data privacy and business confidentiality very seriously. If your project contains sensitive business figures, margins, or private customer records, I am more than happy to sign an NDA before you share any datasets with me.


