Browse categories
Explore
Fiverr Pro
English
$
USD


I would create visual representation of statistical or numerical data. Visuals such as graphs, plots, and charts e.g barchart, piecharts, box plots, line graphs, density plot, xyplot etc. For research, project, and others
Languages
Can you create charts to summarize data
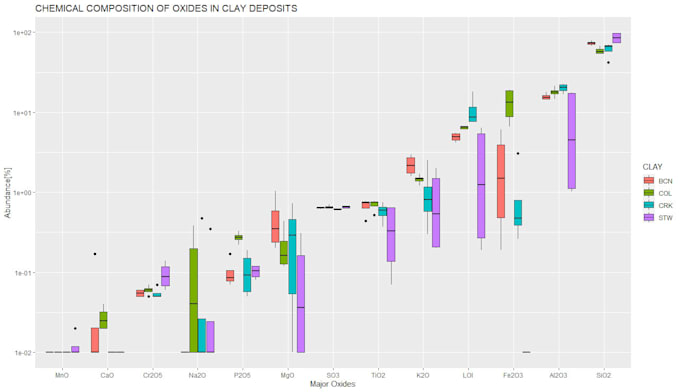
Yes, I can do this using box plots
Can you summarize data in tables
Yes, and I would give all statistical parameters such as mean, median, standard deviation, variations, etc
Can you correct variables in a data
Yes, as long as they're numeric
| (3) | ||
| (0) | ||
| (0) | ||
| (0) | ||
| (0) |
adamsnawla

Oman
---------------
Up to $50
Price
1 day
Duration
joeboutros

Canada
amazing seller will use him every month
Up to $50
Price
4 days
Duration
pearloti

Switzerland
very good job.! fast and result like expected! thanks again

Seller's Response
| (3) | ||
| (0) | ||
| (0) | ||
| (0) | ||
| (0) |
adamsnawla
Oman
---------------
Up to $50
Price
1 day
Duration
joeboutros
Canada
amazing seller will use him every month
Up to $50
Price
4 days
Duration
pearloti
Switzerland
very good job.! fast and result like expected! thanks again
Seller's Response