Browse categories
English
$
USD
Connect to your AI

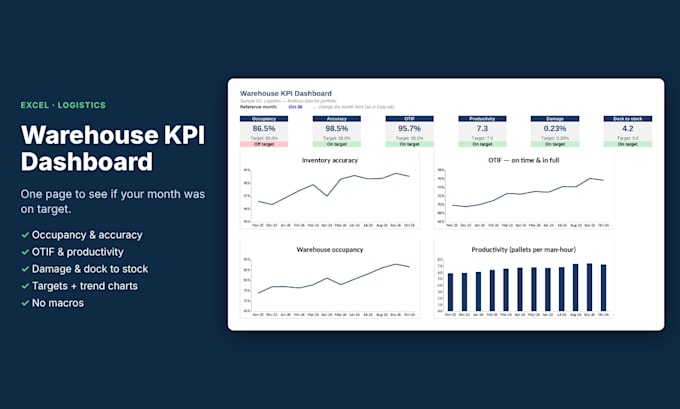
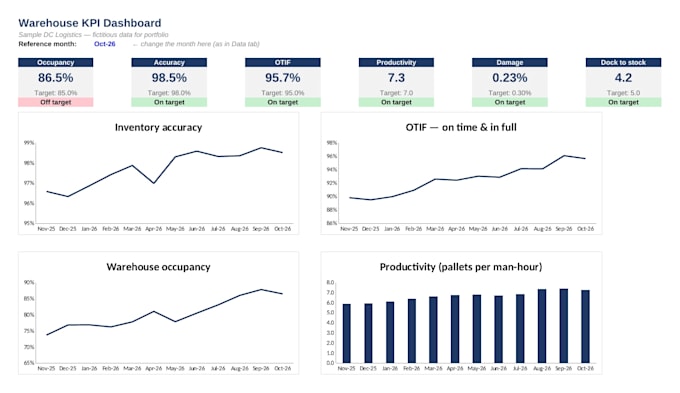
Do you track your warehouse with scattered spreadsheets and still can't see if the month was good or bad? I will build a clean KPI dashboard in Excel that turns your monthly data into a one-page view for managers.
I am a Warehouse Manager with 14+ years in logistics, 13 of them at Ambev (AB InBev), so I know which indicators really matter on the floor.
WHAT YOU GET
- Data tab: one row per month, you only fill in the blue cells
- Targets tab with minimum/maximum logic
- KPI cards with on-target / off-target status
- Monthly trend charts
- Month selector to review any period
- 100% formulas, no macros, works in Excel and Google Sheets
TYPICAL KPIs
Occupancy, inventory accuracy, OTIF, productivity (pallets per man-hour), damage rate, dock to stock, plus transport KPIs in the Premium package.
HOW IT WORKS
1. You tell me your KPIs and send a sample of your data (fictitious is fine)
2. I build the dashboard and send it for review
3. I adjust it until it fits your operation
Send me a message before ordering if you need custom KPIs.
Logistics Excel Expert: Inventory, Dashboards and KPIs
Languages
Do I need special software or macros?
No. The dashboard uses only standard formulas, so it opens in any recent Excel version and in Google Sheets, with no macros or add-ins.
Can you use my own KPIs and data?
Yes. Send me your KPI list and a sample of your data (fictitious values are fine) and I build the dashboard around your operation.